Live Query
Live Query allows you to ask Kolide to obtain data about one or many devices that is then retrieved and displayed in real-time.
What Are Live Queries?
Live Queries are the fastest way to obtain the latest information about the state of the device enrolled in Kolide. They use the osquery component of Kolide’s agent, which enables Kolide administrators to use SQL to ask a device practically any conceivable question about its current state.
For example, suppose we want to ask all the devices connected to Kolide how many seconds have passed since they’ve been restarted; we can run the following query:
SELECT total_seconds FROM uptime;
If run on the osquery daemon locally, I might get a result that looks like
+---------------+
| total_seconds |
+---------------+
| 165127        |
+---------------+
Instead of running this query on one device at a time with scripting tools, we can use Kolide’s Live Query feature to run it on all the devices in our fleet and view the results immediately.
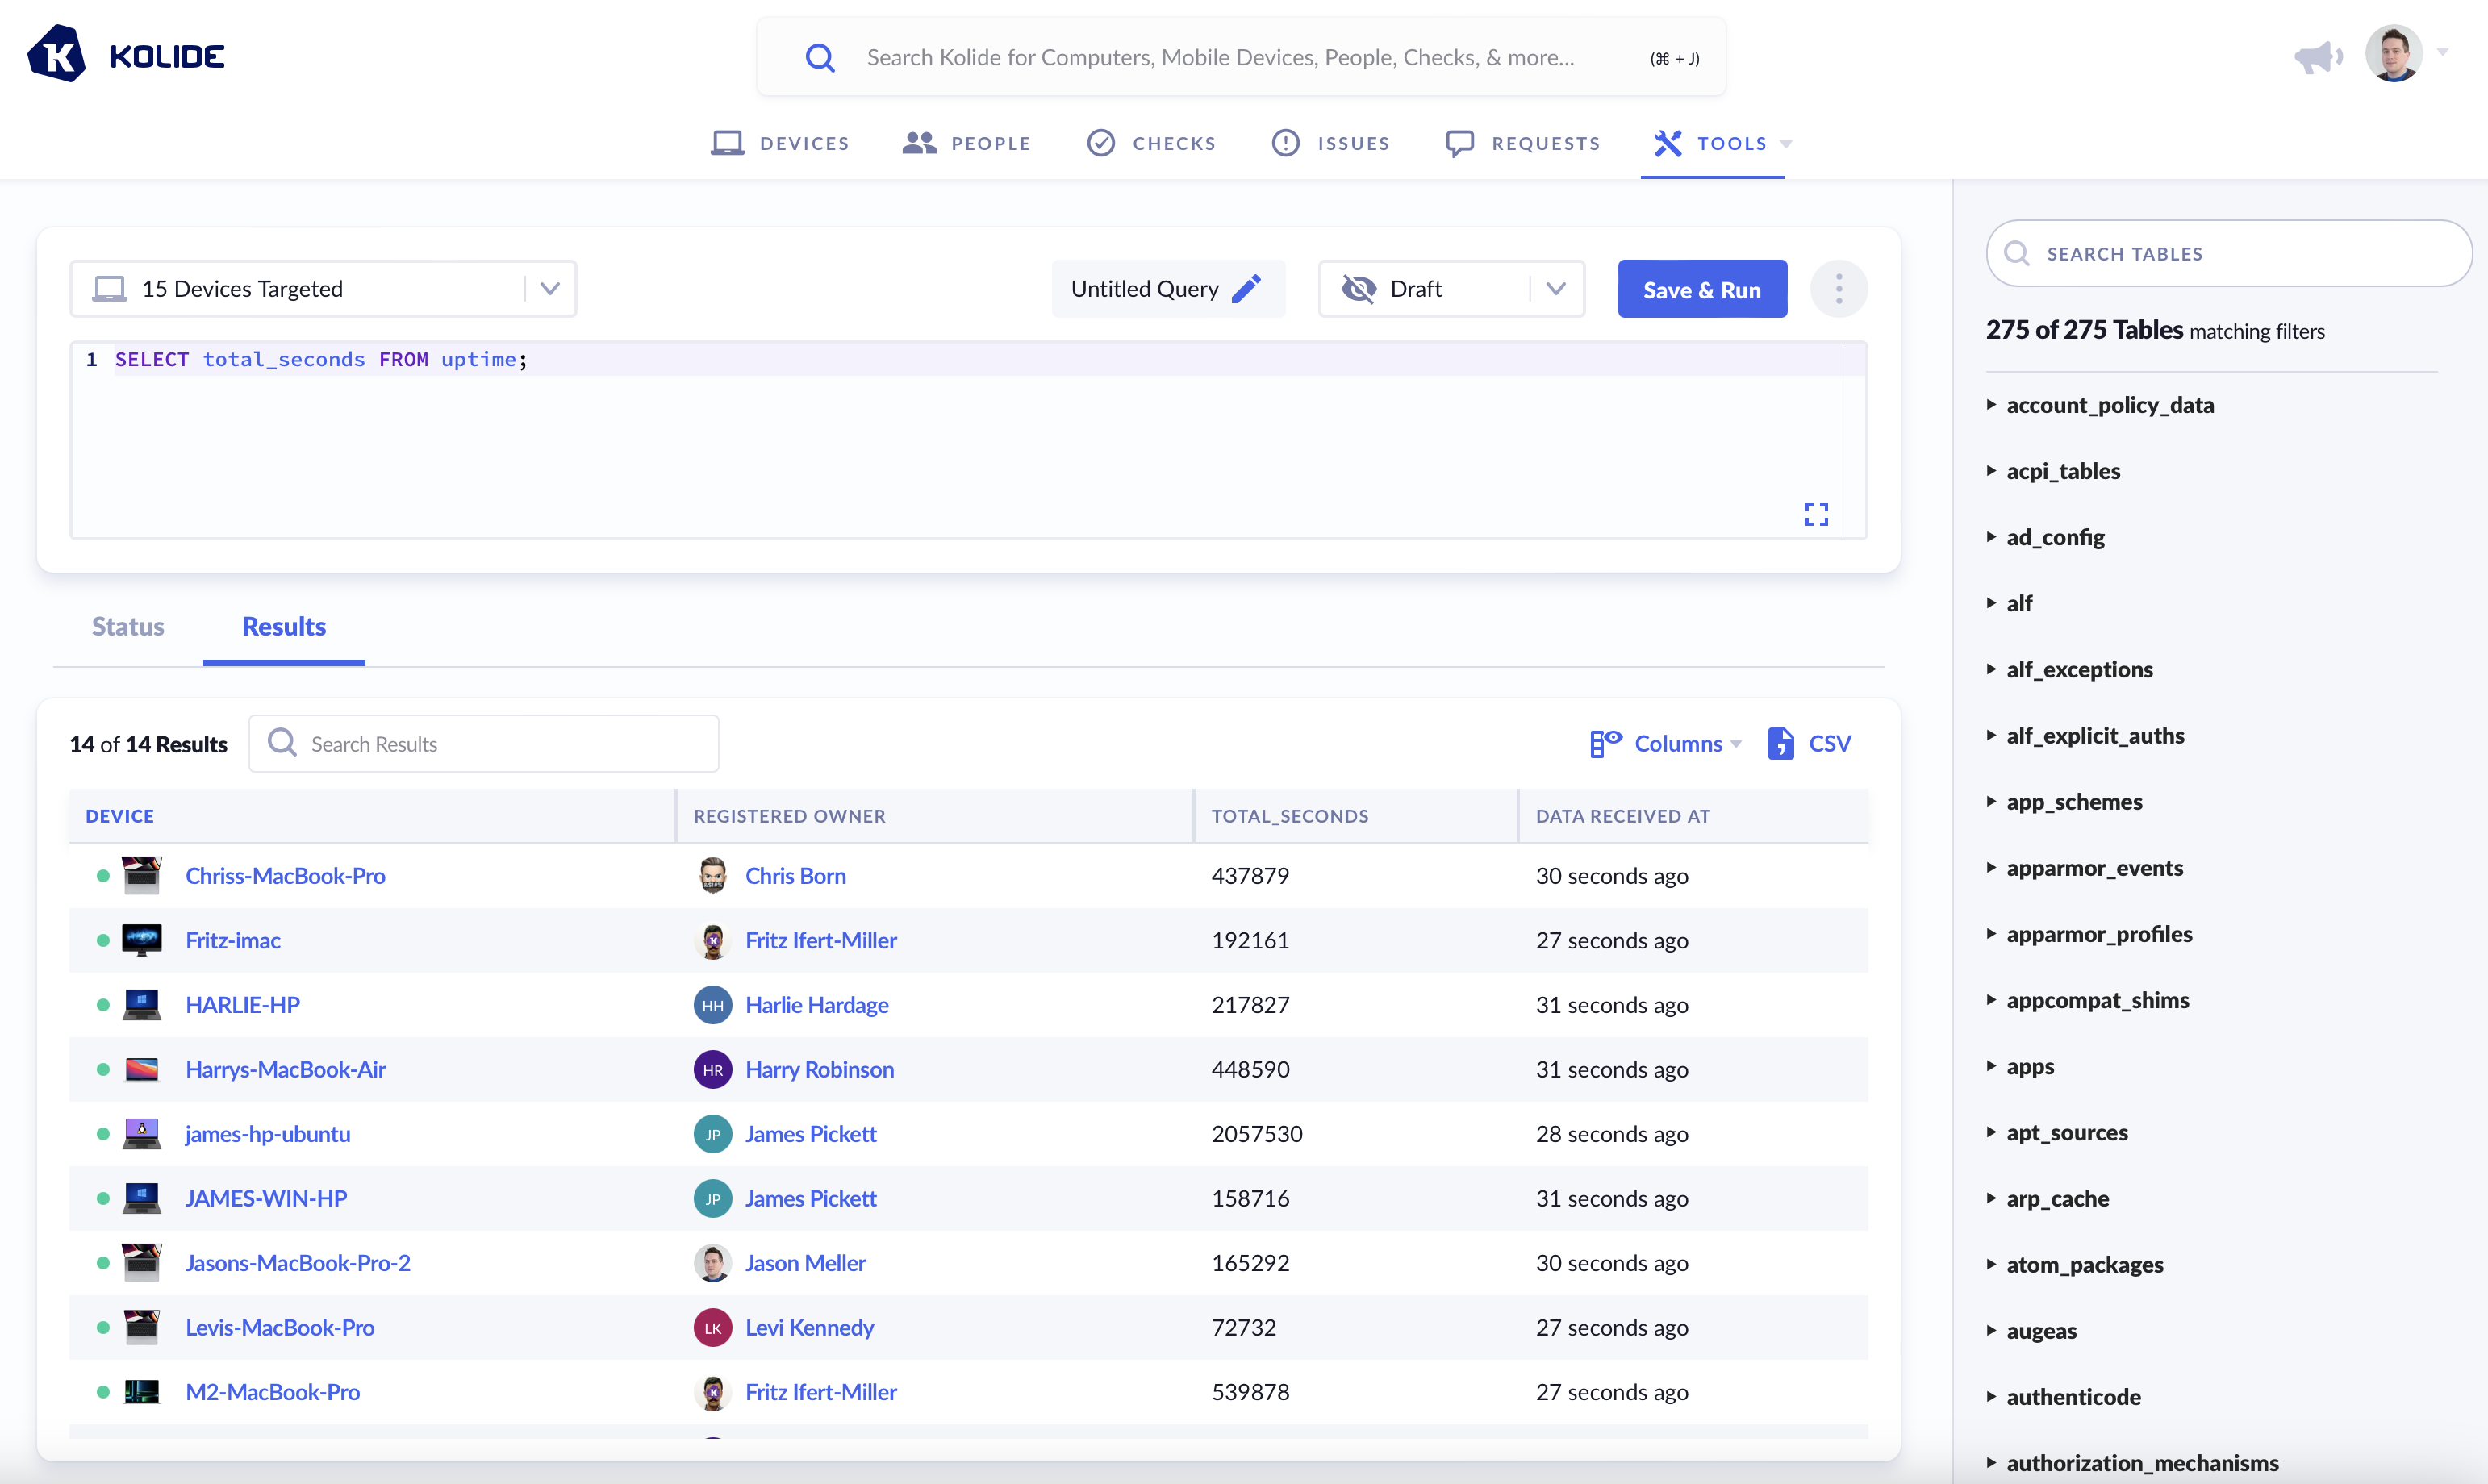
By using Live Query, you can run any osquery SQL query across all of your enrolled devices and get back the results nearly instantly.
The general process works like this:
A Kolide administrator composes a Live Query in Kolide, which targets specific devices enrolled in the application.
When the osquery daemon in the Kolide Agent checks in to Kolide (approximately every 30 seconds), it asks if there are any new Live Queries to run. If there are, the Kolide service will transmit them.
The osquery daemon will run the queries on the device and transmit the results back to the Kolide service during the next check-in.
The Kolide service processes, stores, and displays the results of the Live Query as they are sent in from the targeted devices.
You can learn more about how this feature works under the hood by reading about distributed queries in the official Osquery documentation.
Getting Started
To get started, log into Kolide and click on Tools from the top navigation and select Live Query.

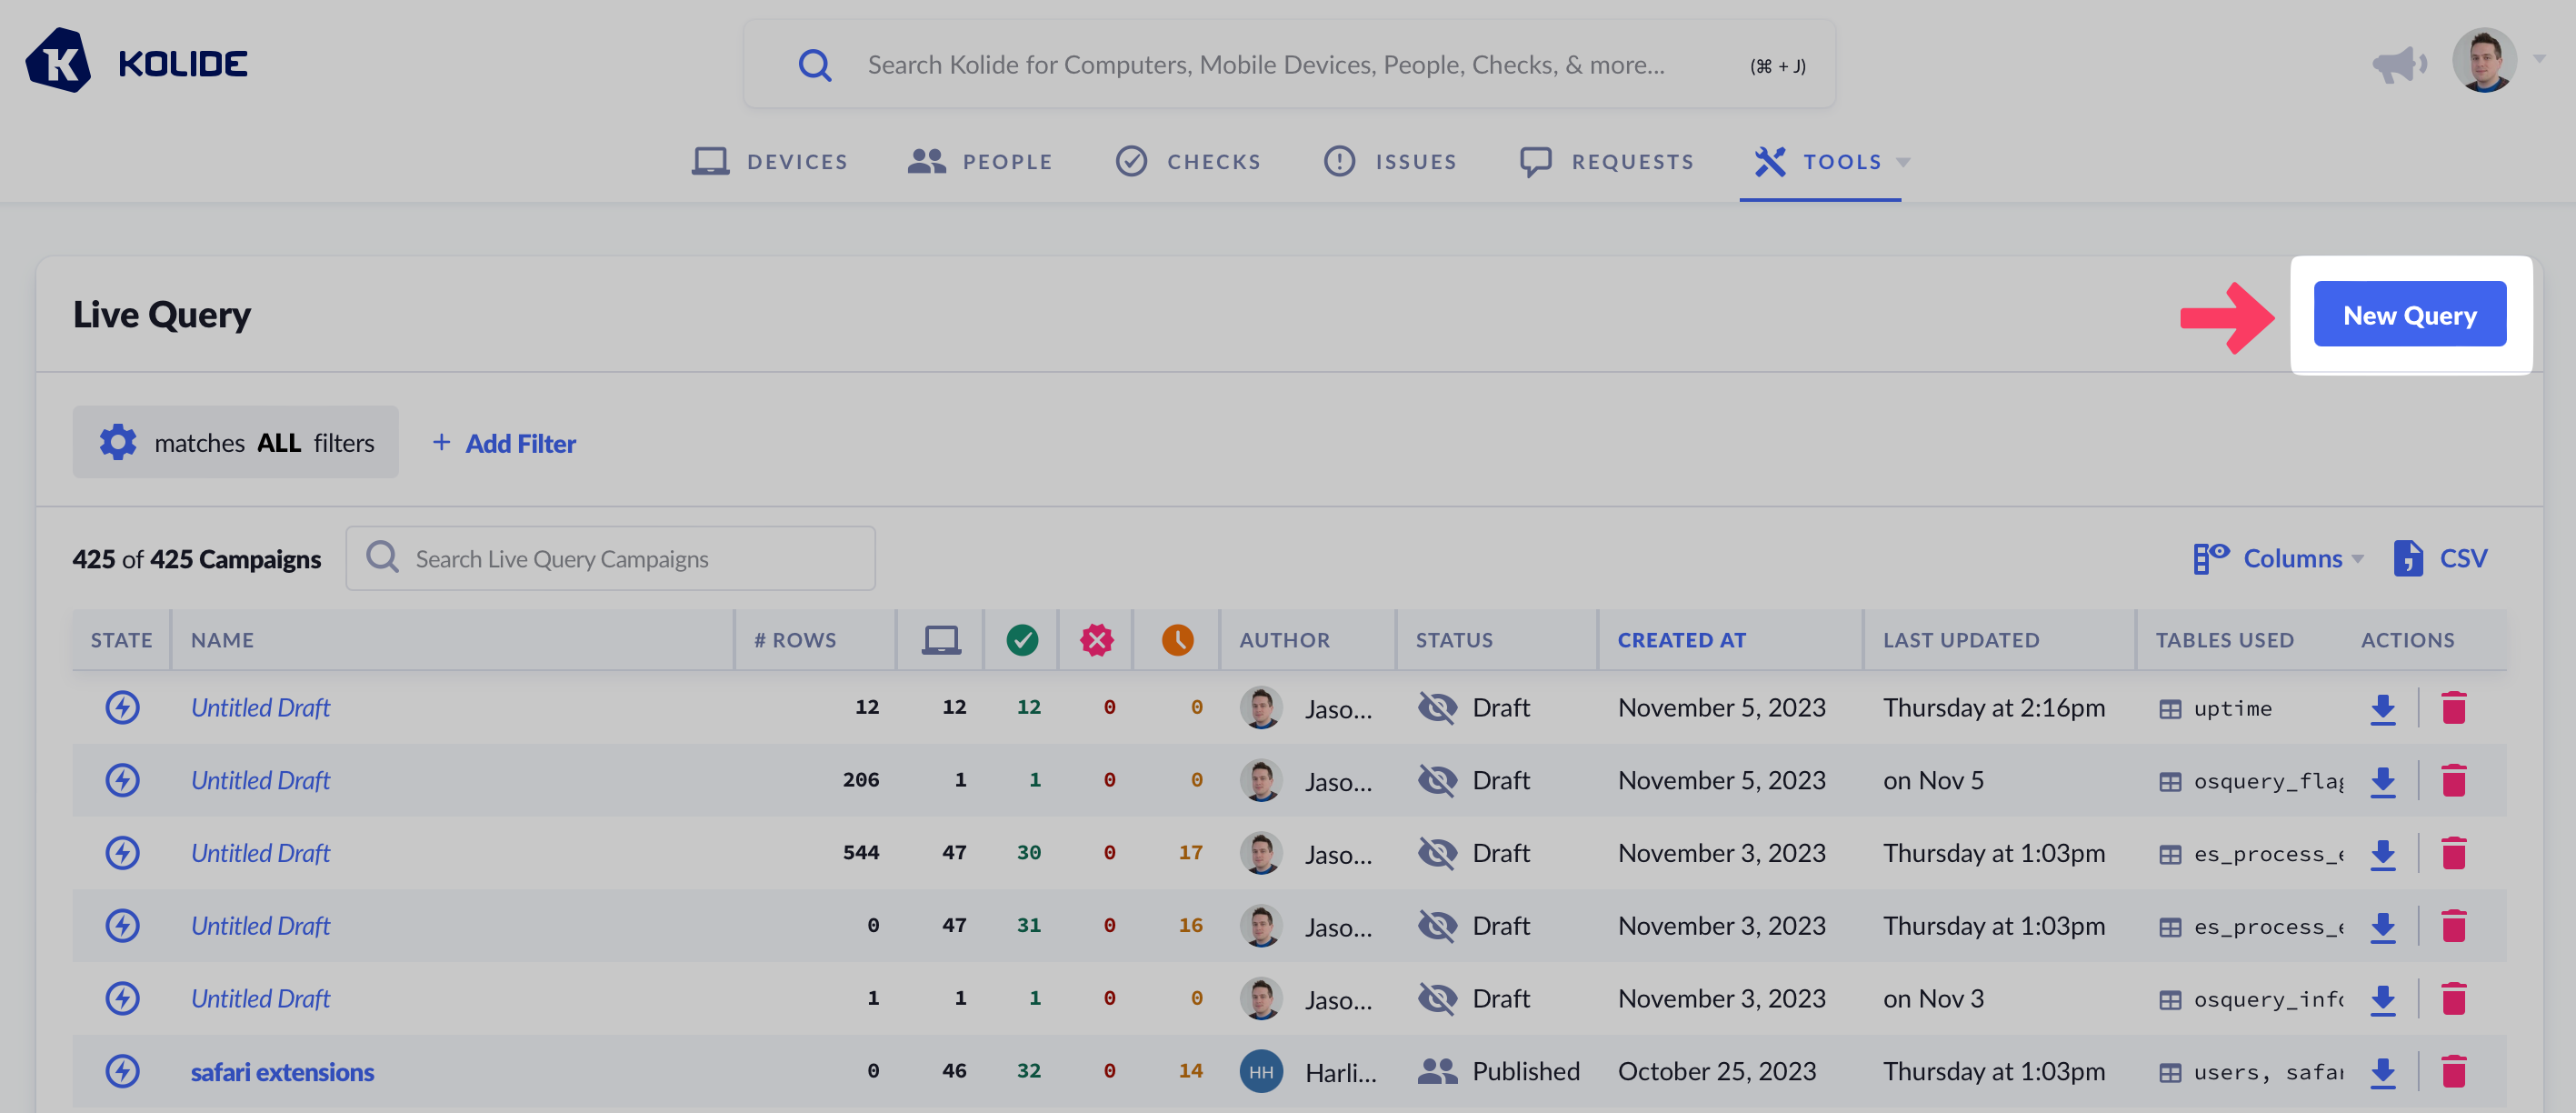
If this is your first time using Live Query, you’ll be taken straight to the Live Query editor. If there are other previous queries, you’ll be taken to a list page. To get to the editor, click New Query in the upper-right corner of the table.
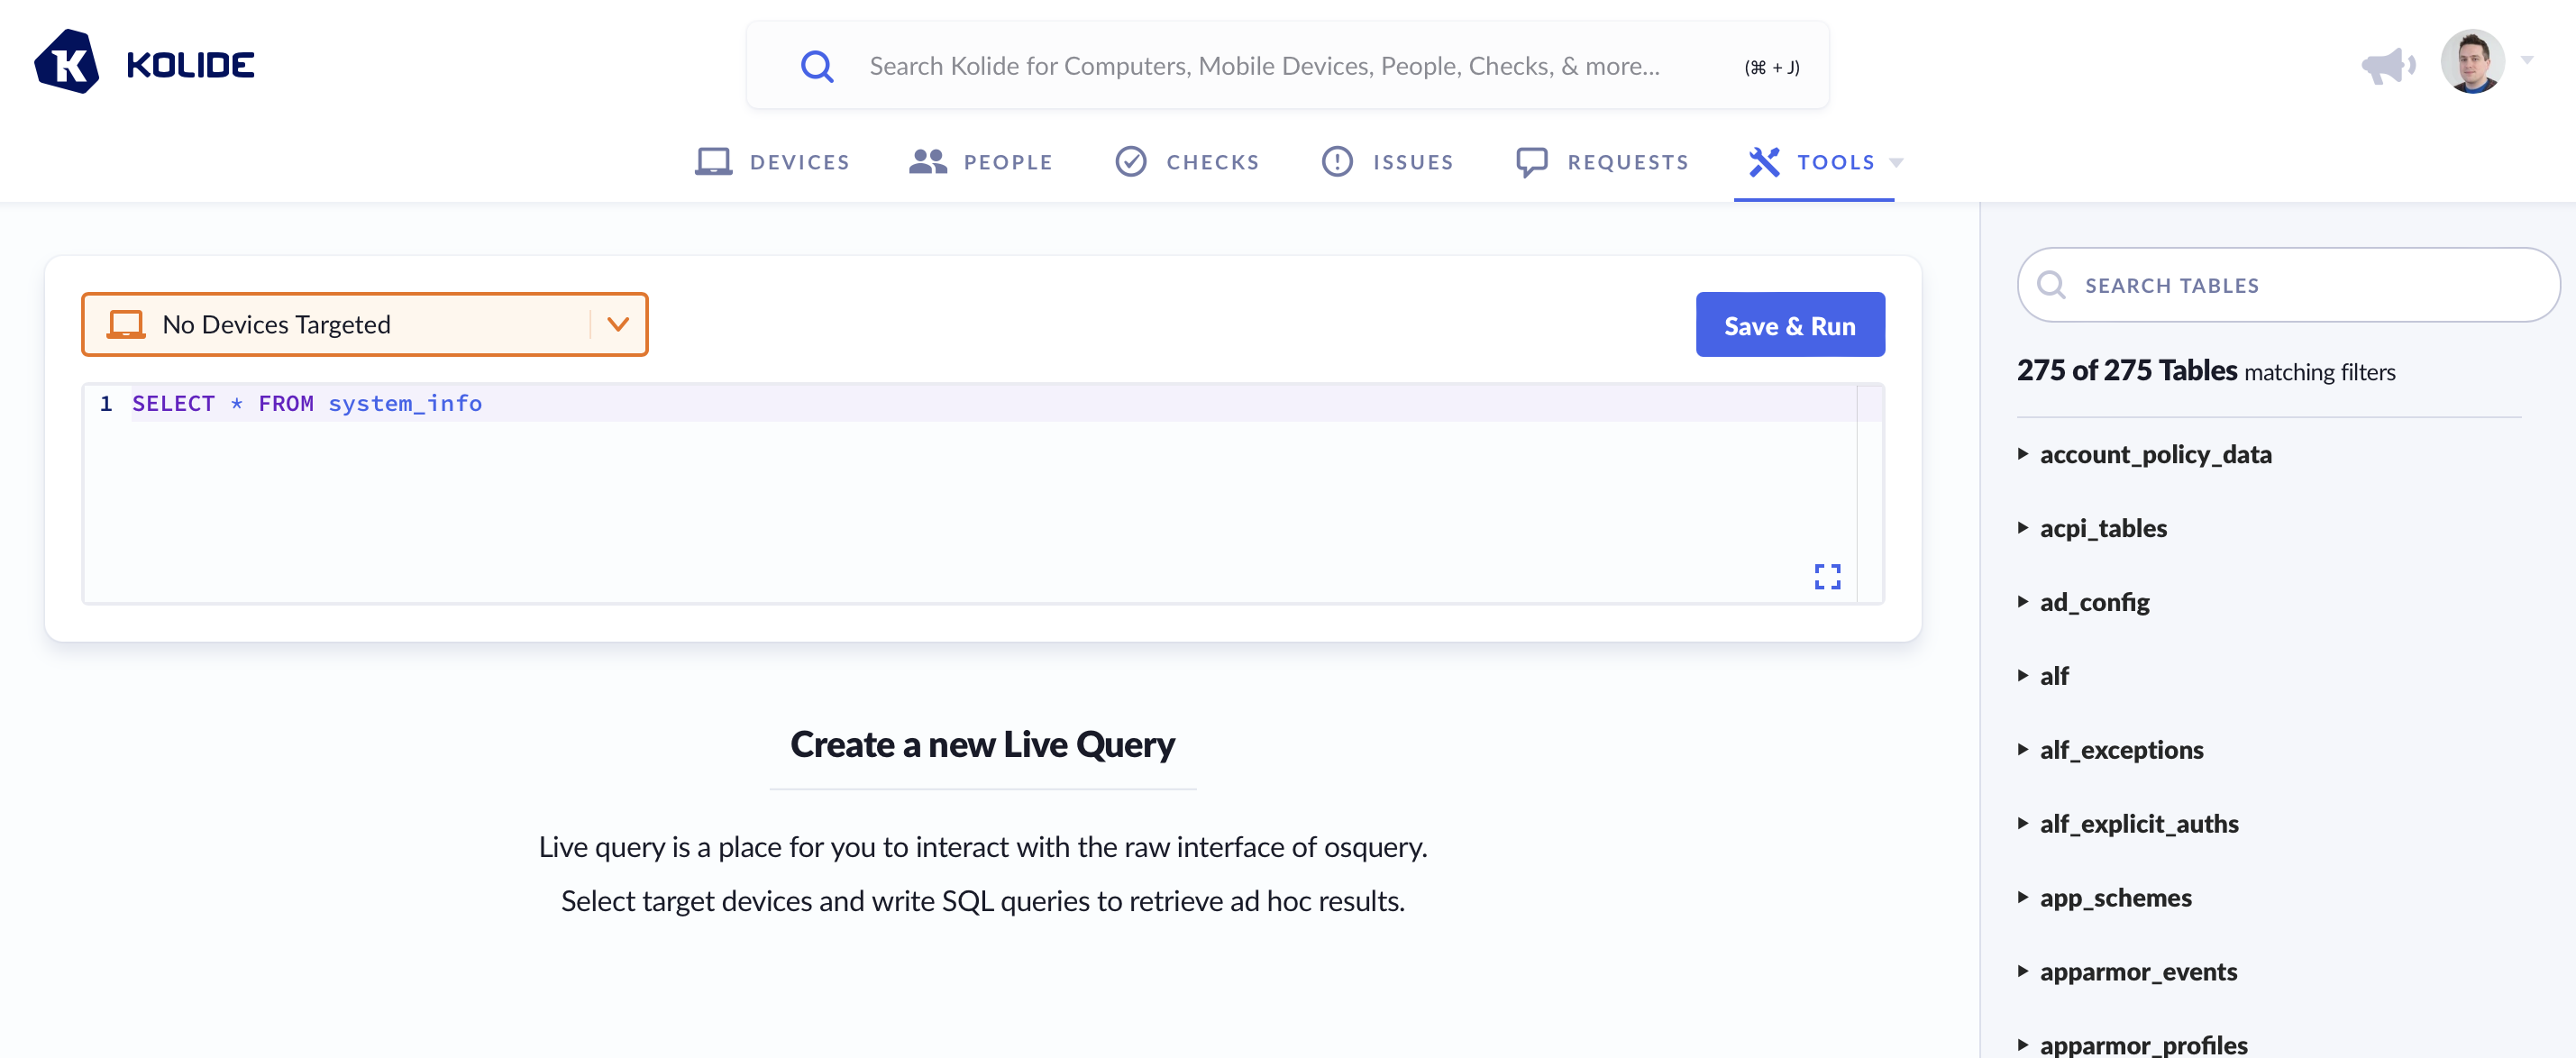
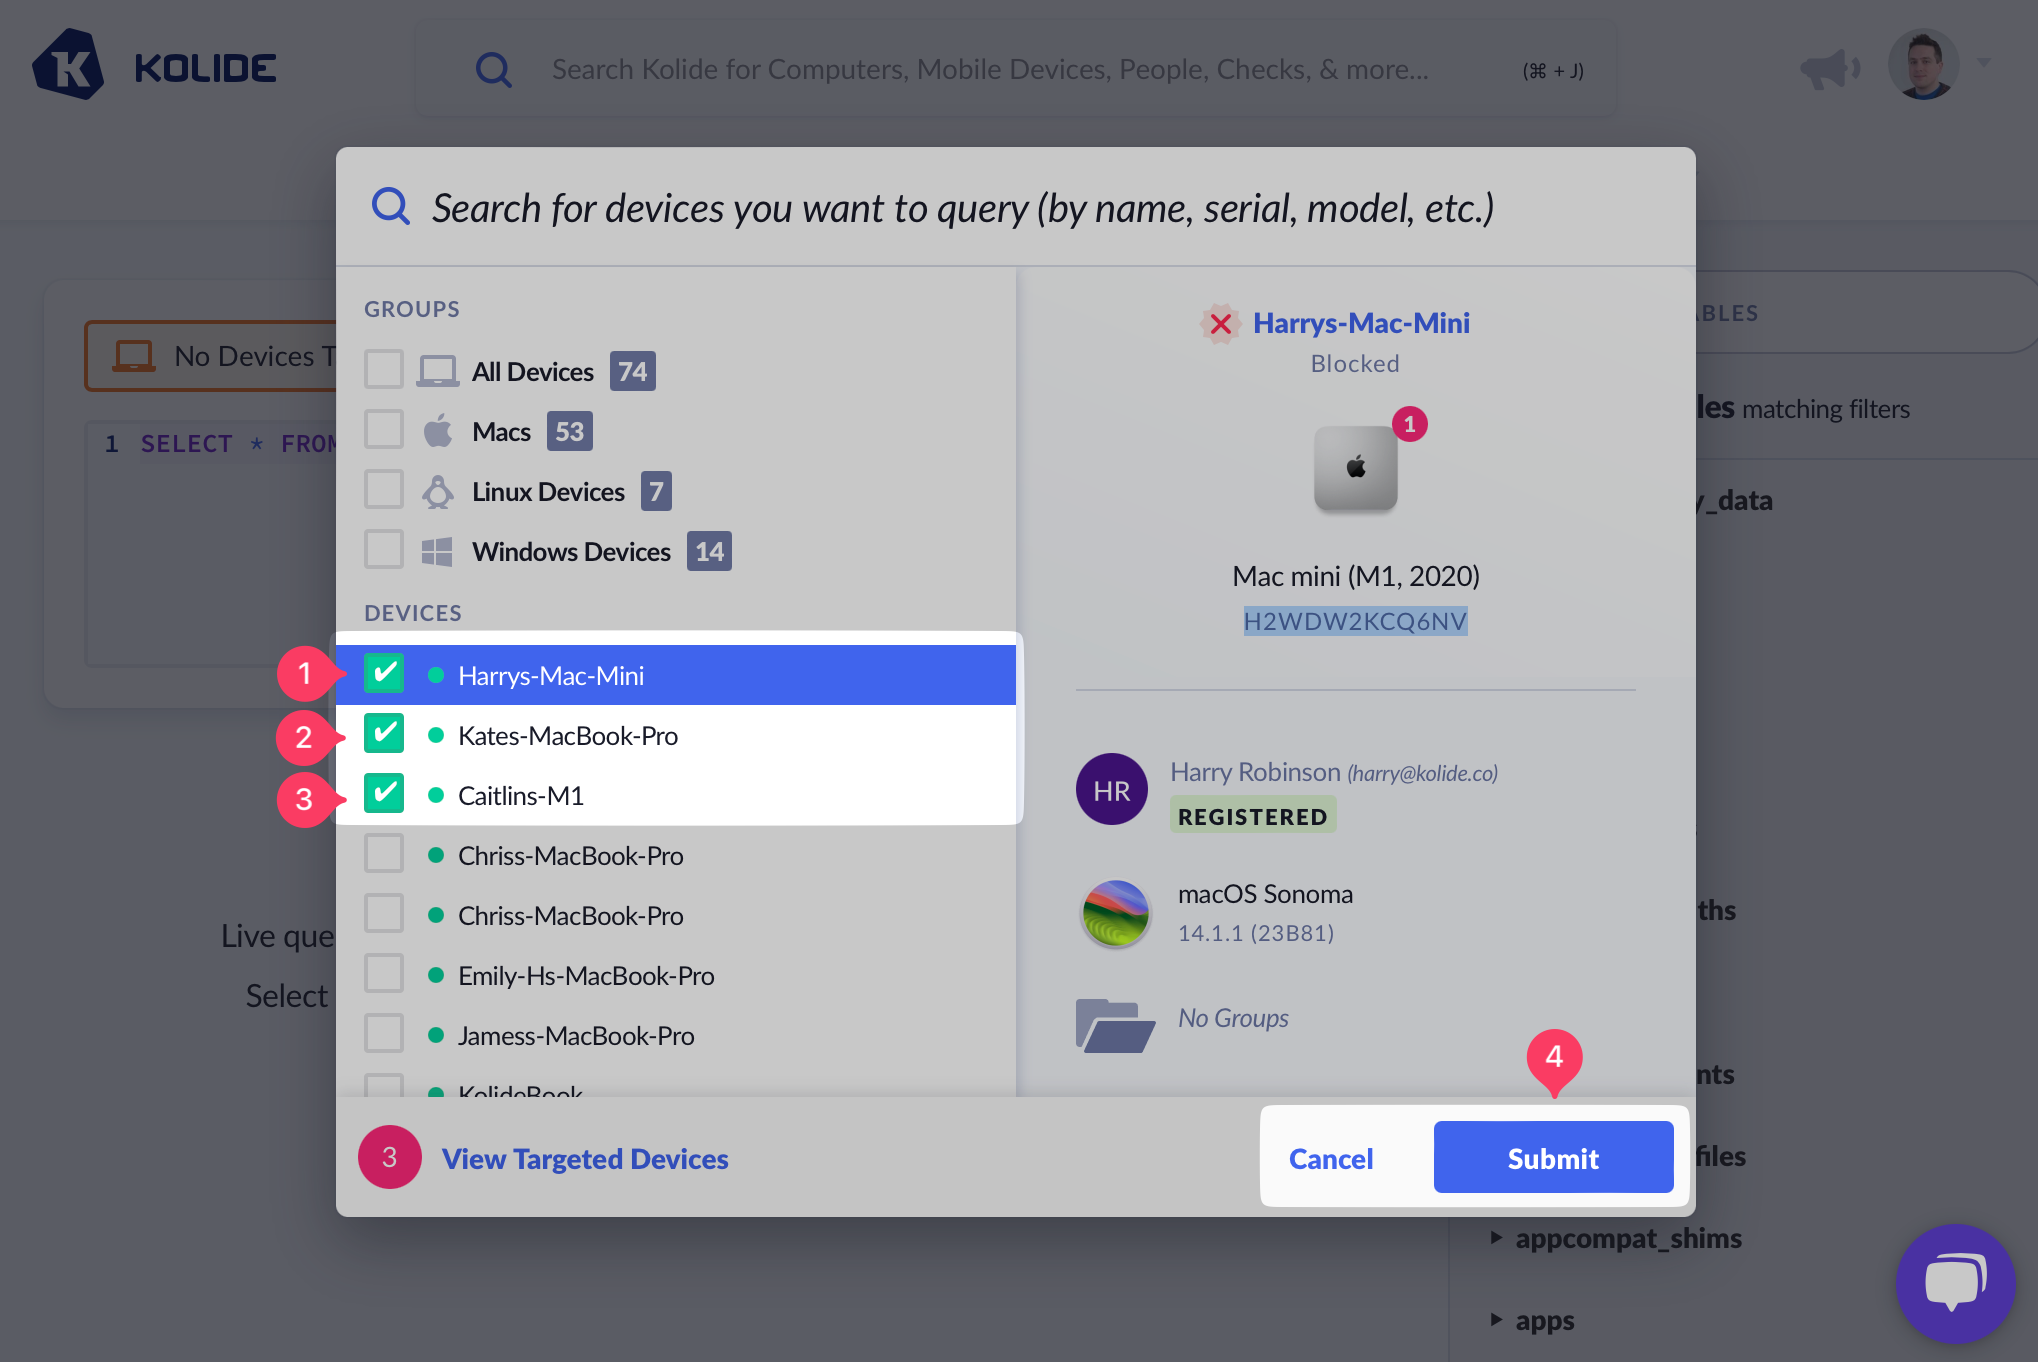
Once in the editor, begin by selecting the targets that will run this query, by clicking the orange No Devices Targeted menu.
The target selector can be used to pick the query’s targets. To add a target, click on the checkbox next to each device you’d like to add. If you want more information about a device, you can click its name, and the preview pane on the right will reveal more information. You can also filter the list of devices using the search box at the very top of the pop-up window. Once you are satisfied with the targets chosen, click Submit to confirm your selections.
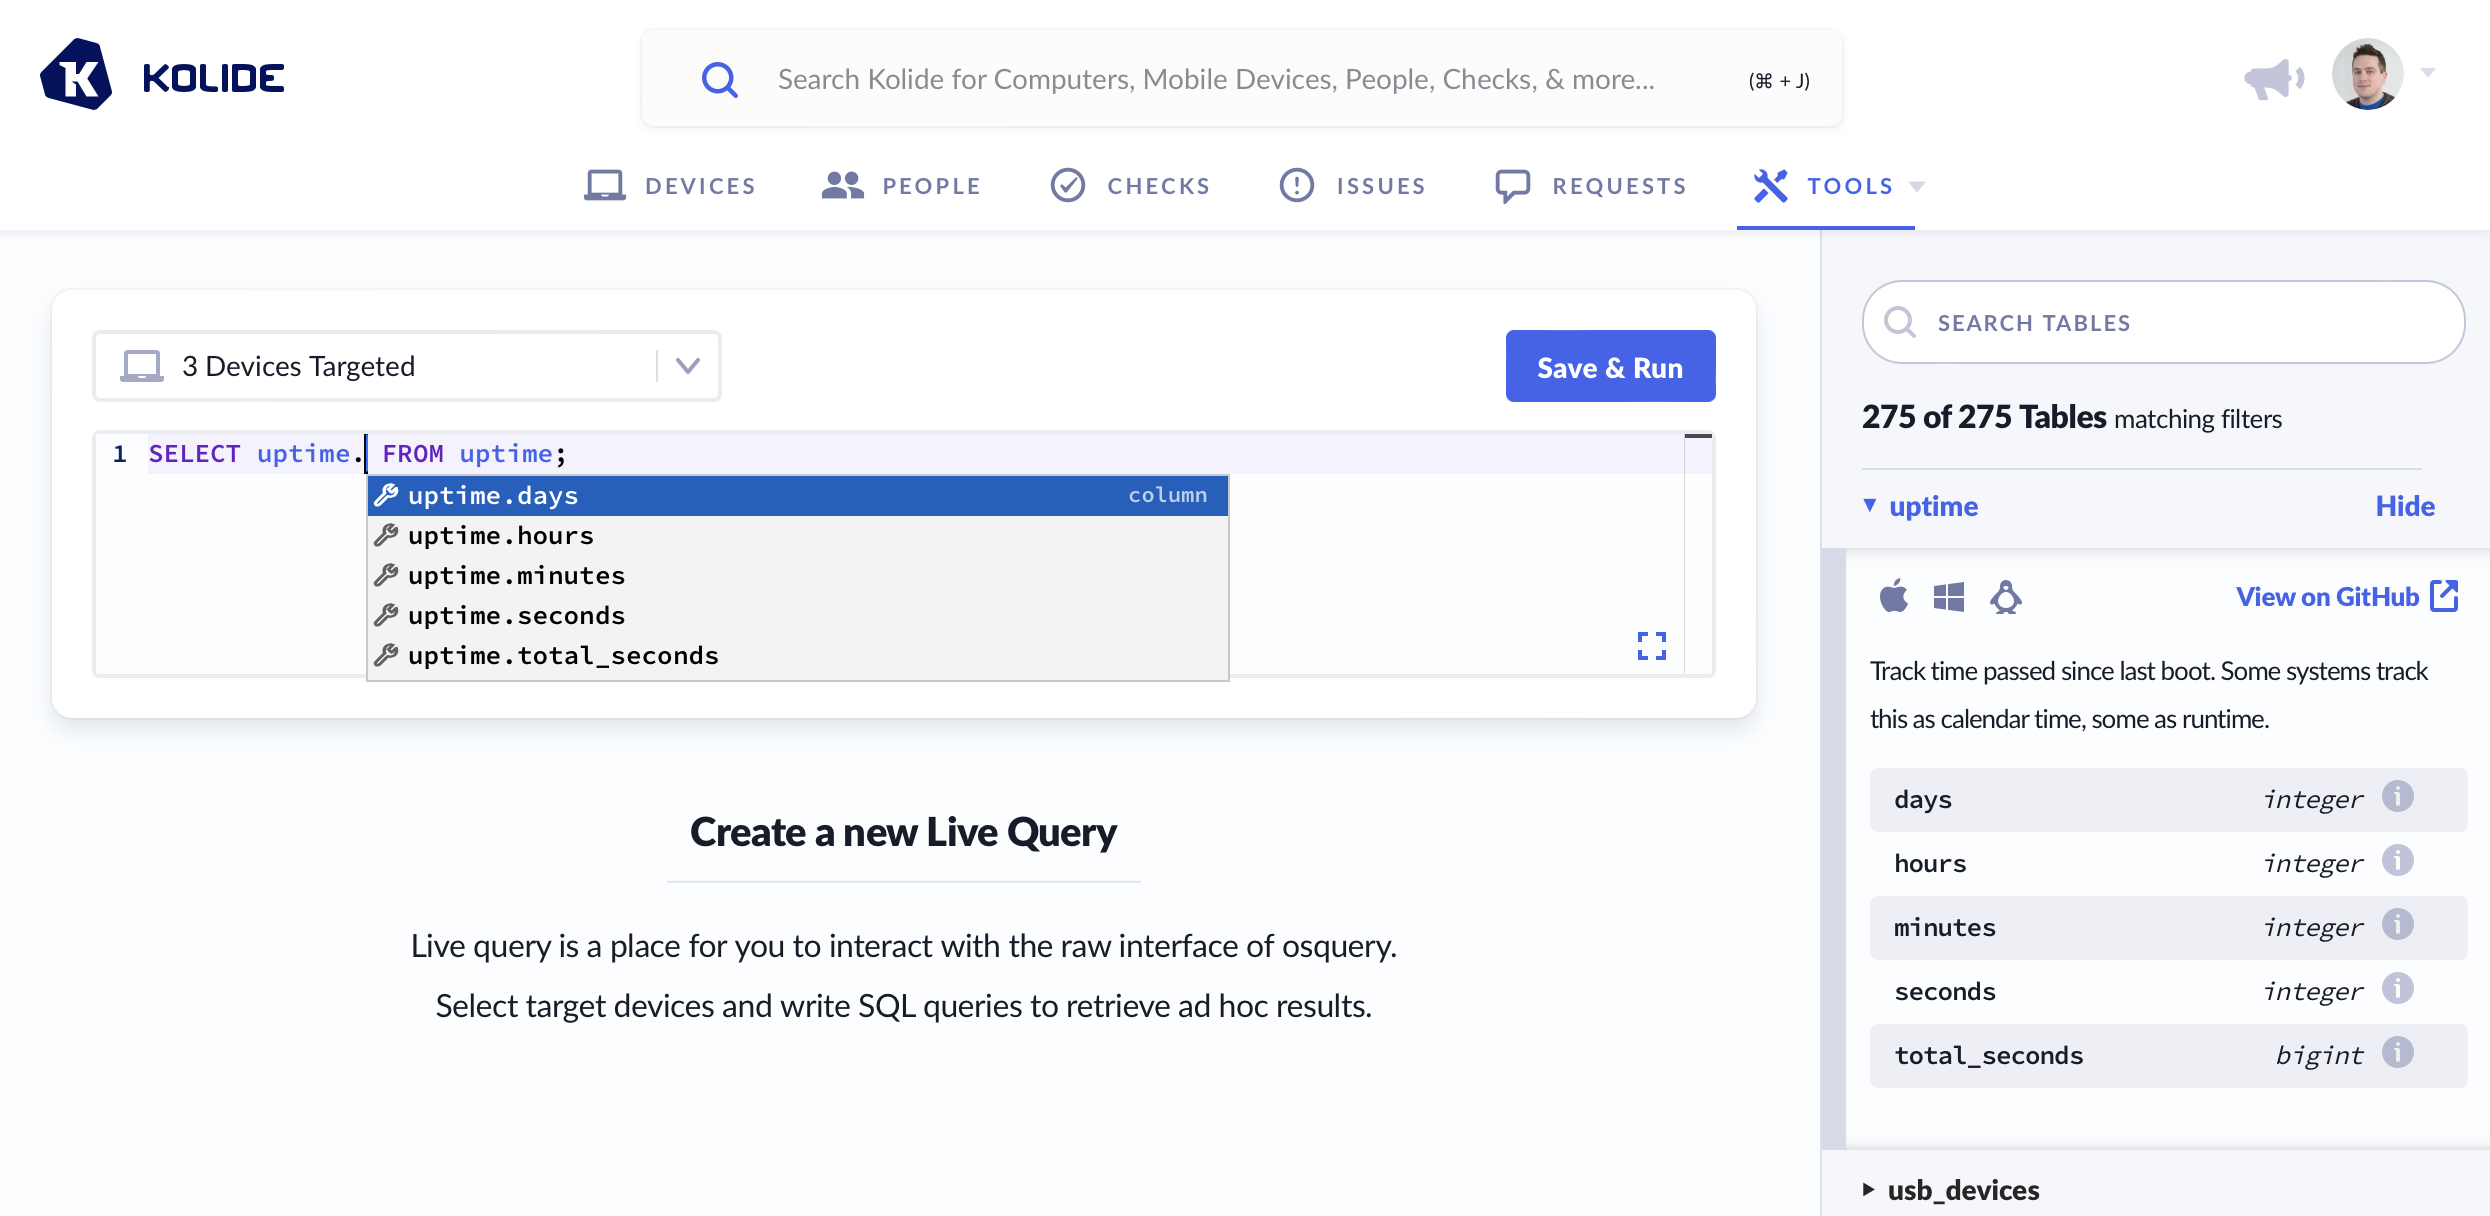
Next, modify the osquery SQL. The editor features both autocomplete and inline documentation on the available tables you can query in the osquery portion of the Kolide agent.
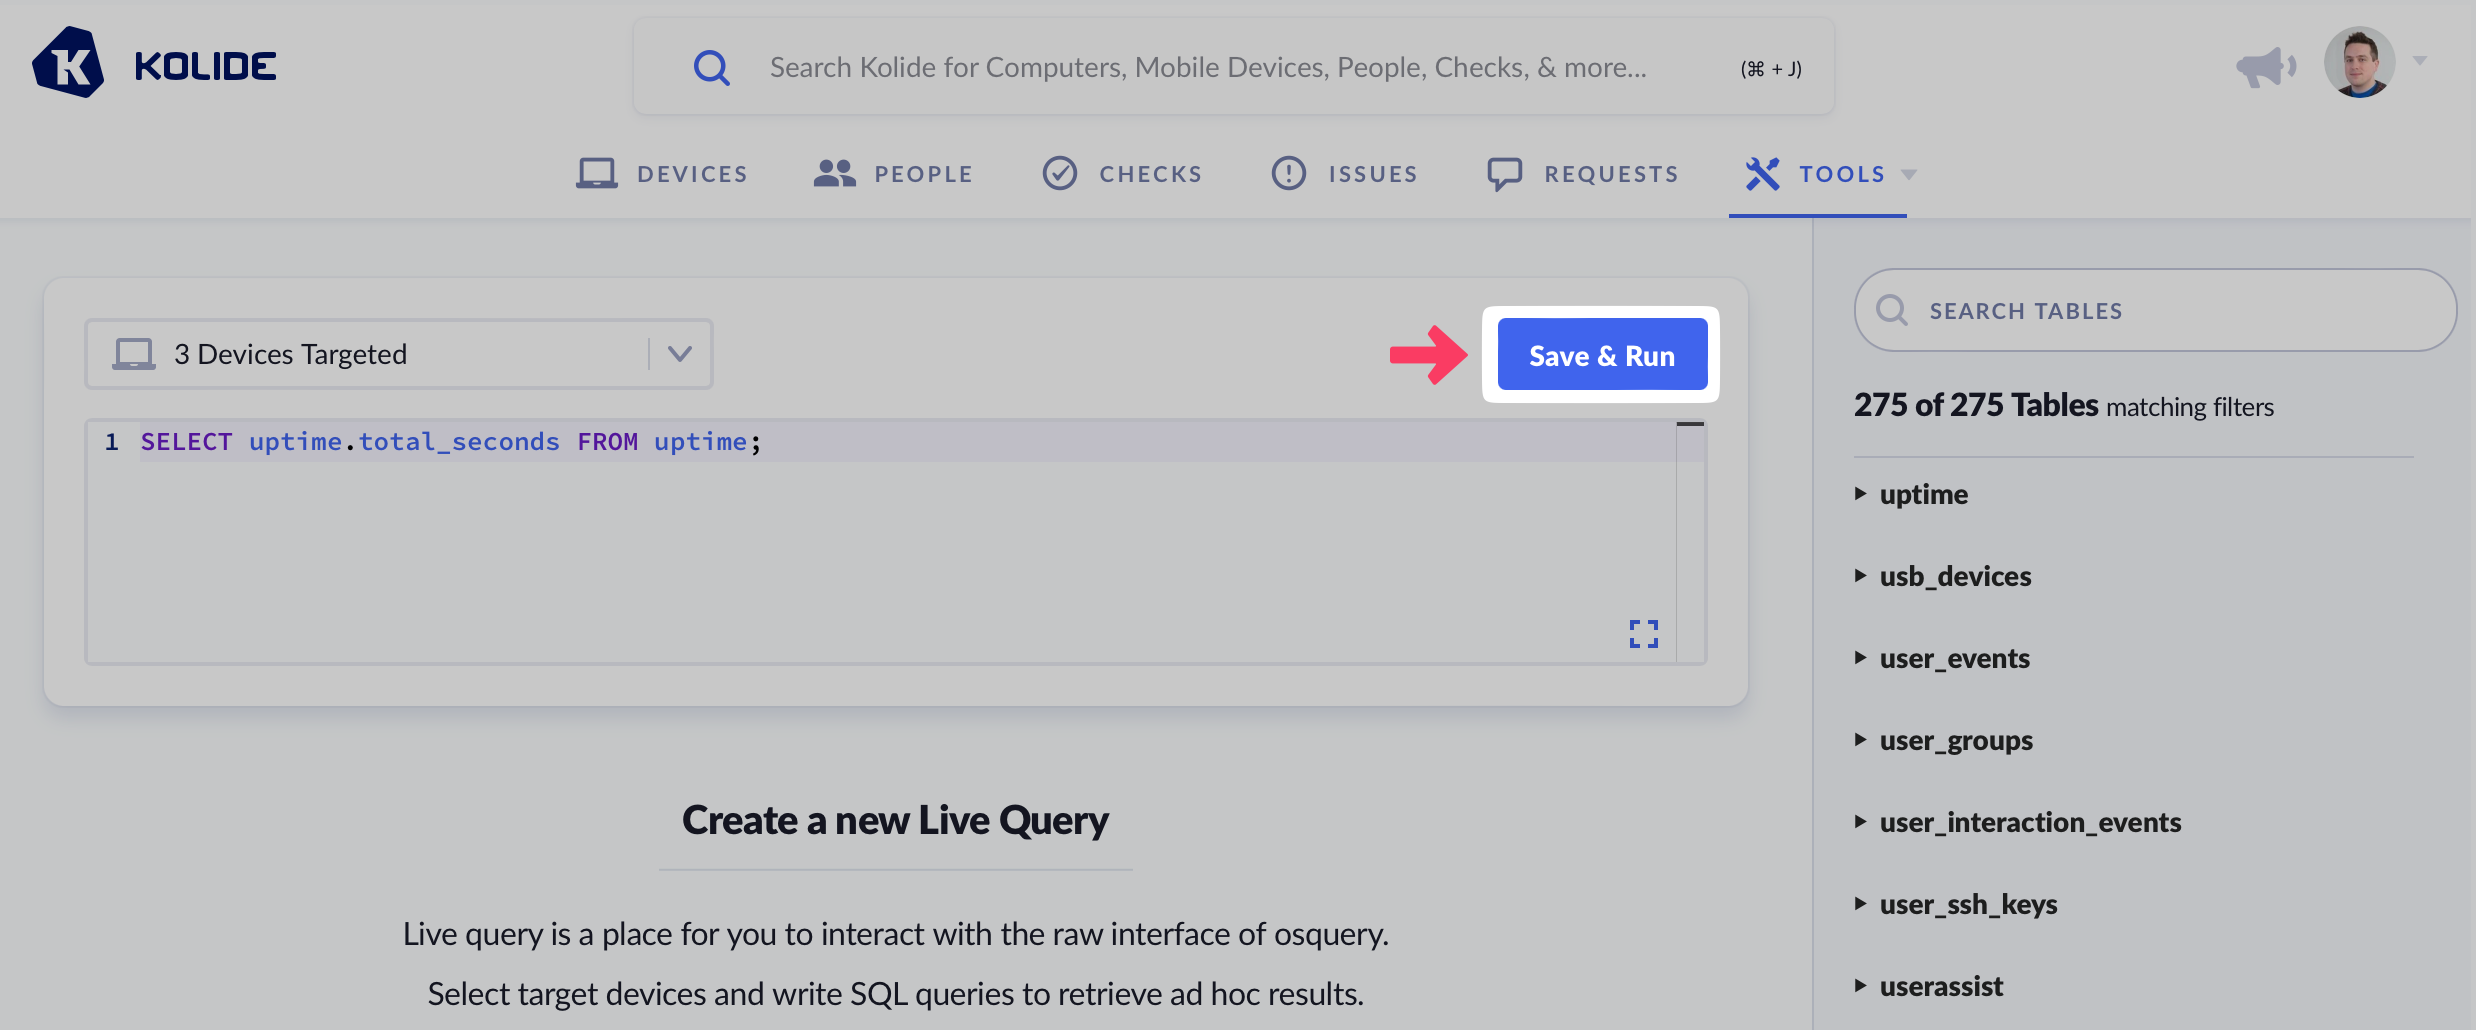
Once you’re happy with your query, click Save & Run.
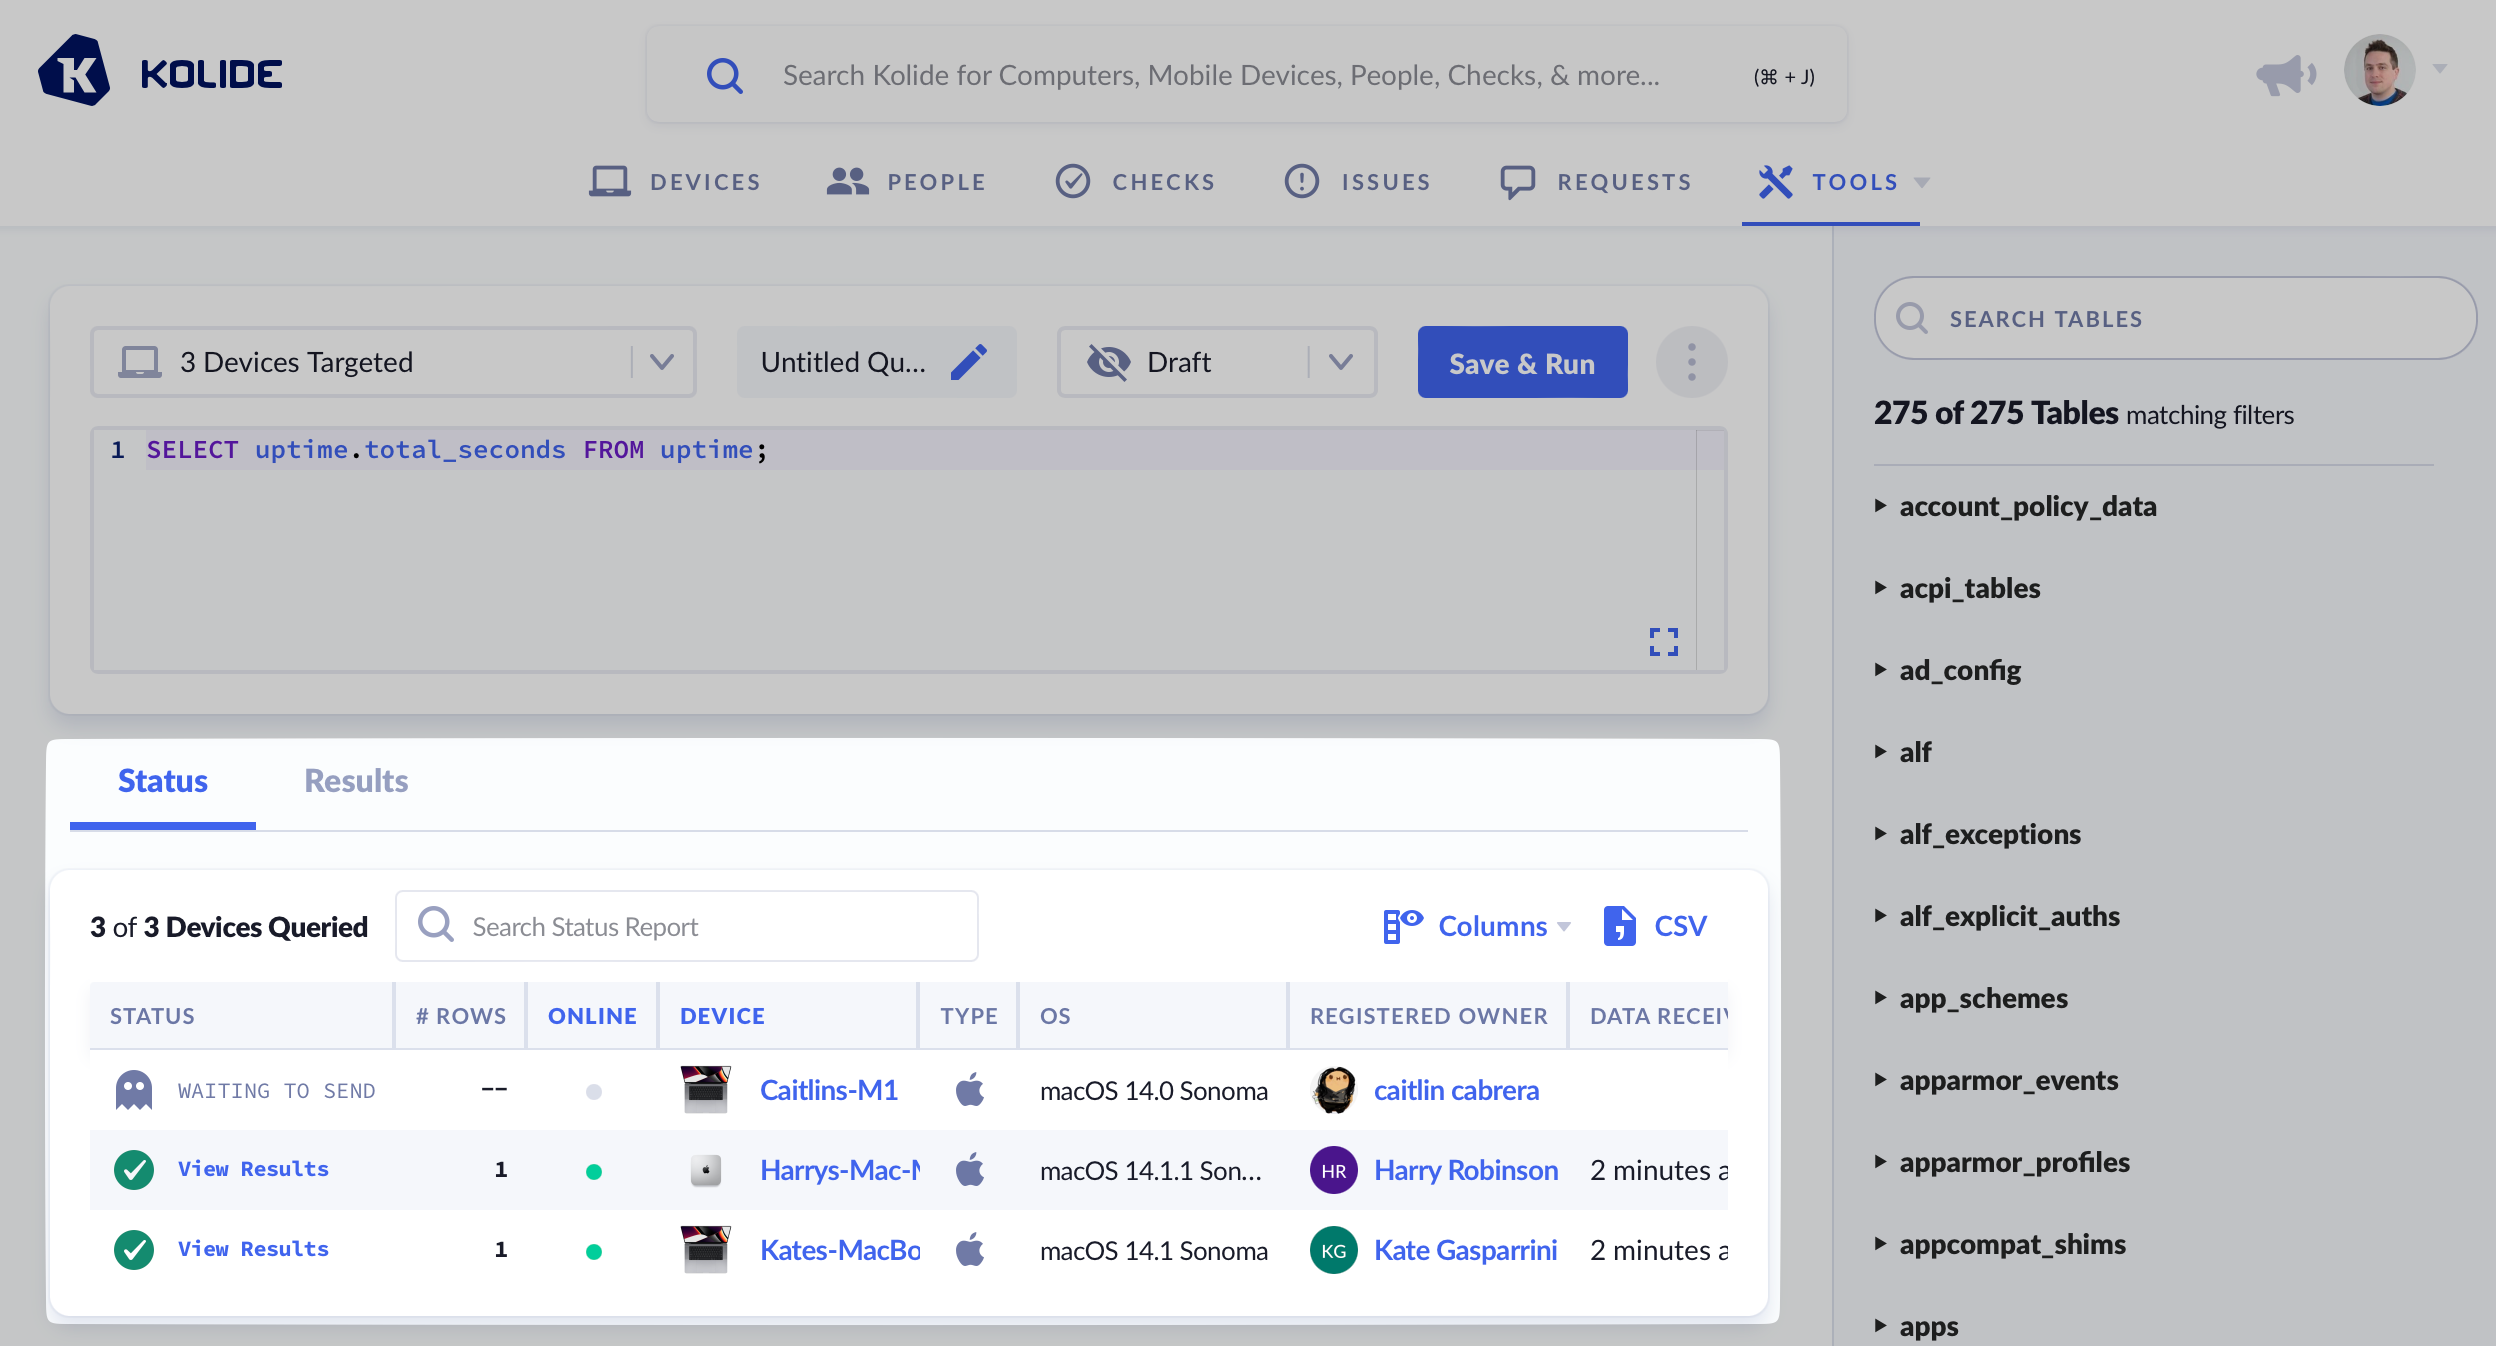
After a few seconds, you should see the results start to roll in.
Viewing Live Query Results
Once you’ve run a Live Query, results will appear below the SQL code editor. There are two ways to review the data returned by a query: the Status tab and the Results tab.
Status Tab
The status tab is the default selected tab and gives you an overview of the completion status of your query across the query’s targets. The status of each query can be one of the following:
- Waiting to send - Kolide is waiting for the agent to check in so it can send it the query. A device may remain in this state for a while if it is offline.
- Waiting for results - The agent has received the query and is running it. Kolide is waiting for the results when the agent checks in again.
- View Results: Results have successfully been received (click the link to view the results for that device).
- Errored: Kolide received an error message back from the agent when it attempted to run the query (the error message will appear in a few moments once Kolide retrieves it from the Agent’s error log.)
Results Tab
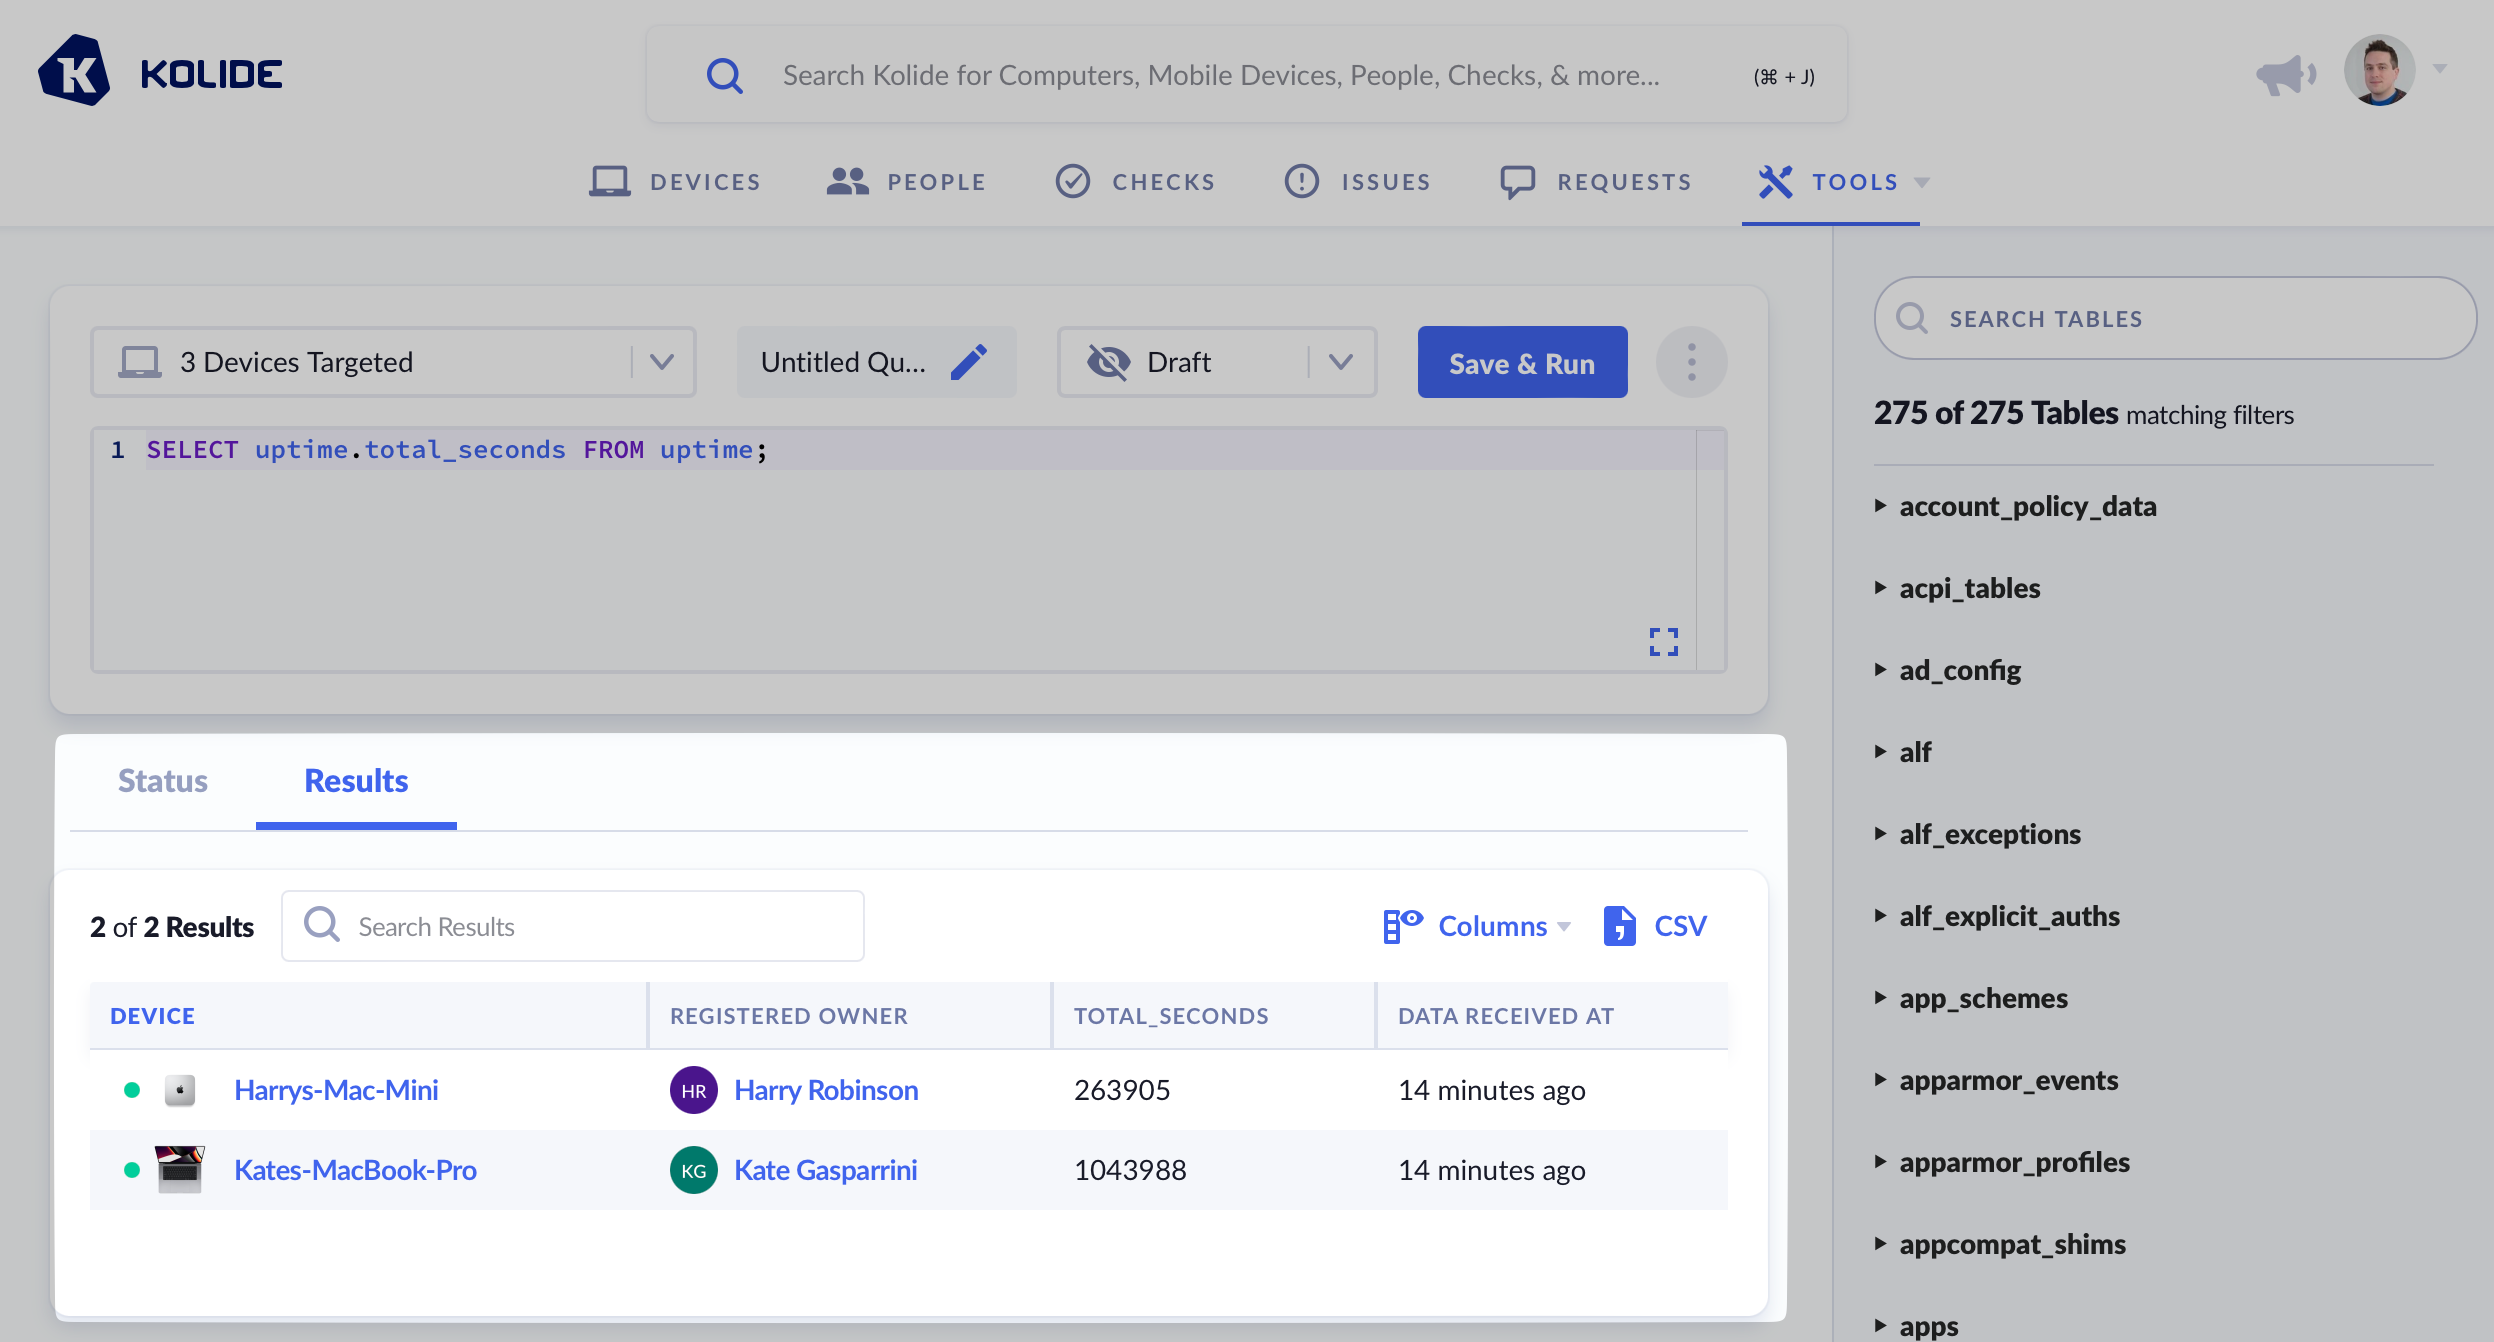
The results tab contains a combined view of all the device’s results. Unlike the table in the status tab, a single device can produce many rows.
Query Visibility
By default, Live Queries that you write and their results are only visible to their original author. To share a Live Query with others, you will need to publish it. On a query you’ve run at least once, do the following:
- Click on the Draft dropdown next to the query’s name.
- In the pop-up that appears, select Published.
- If you haven’t set a name for your query, enter it in the form field.
- Click Save Settings
Once published, you can send the link to the Live Query to any admins, or, they can discover it on the Live Query Campaign list view.
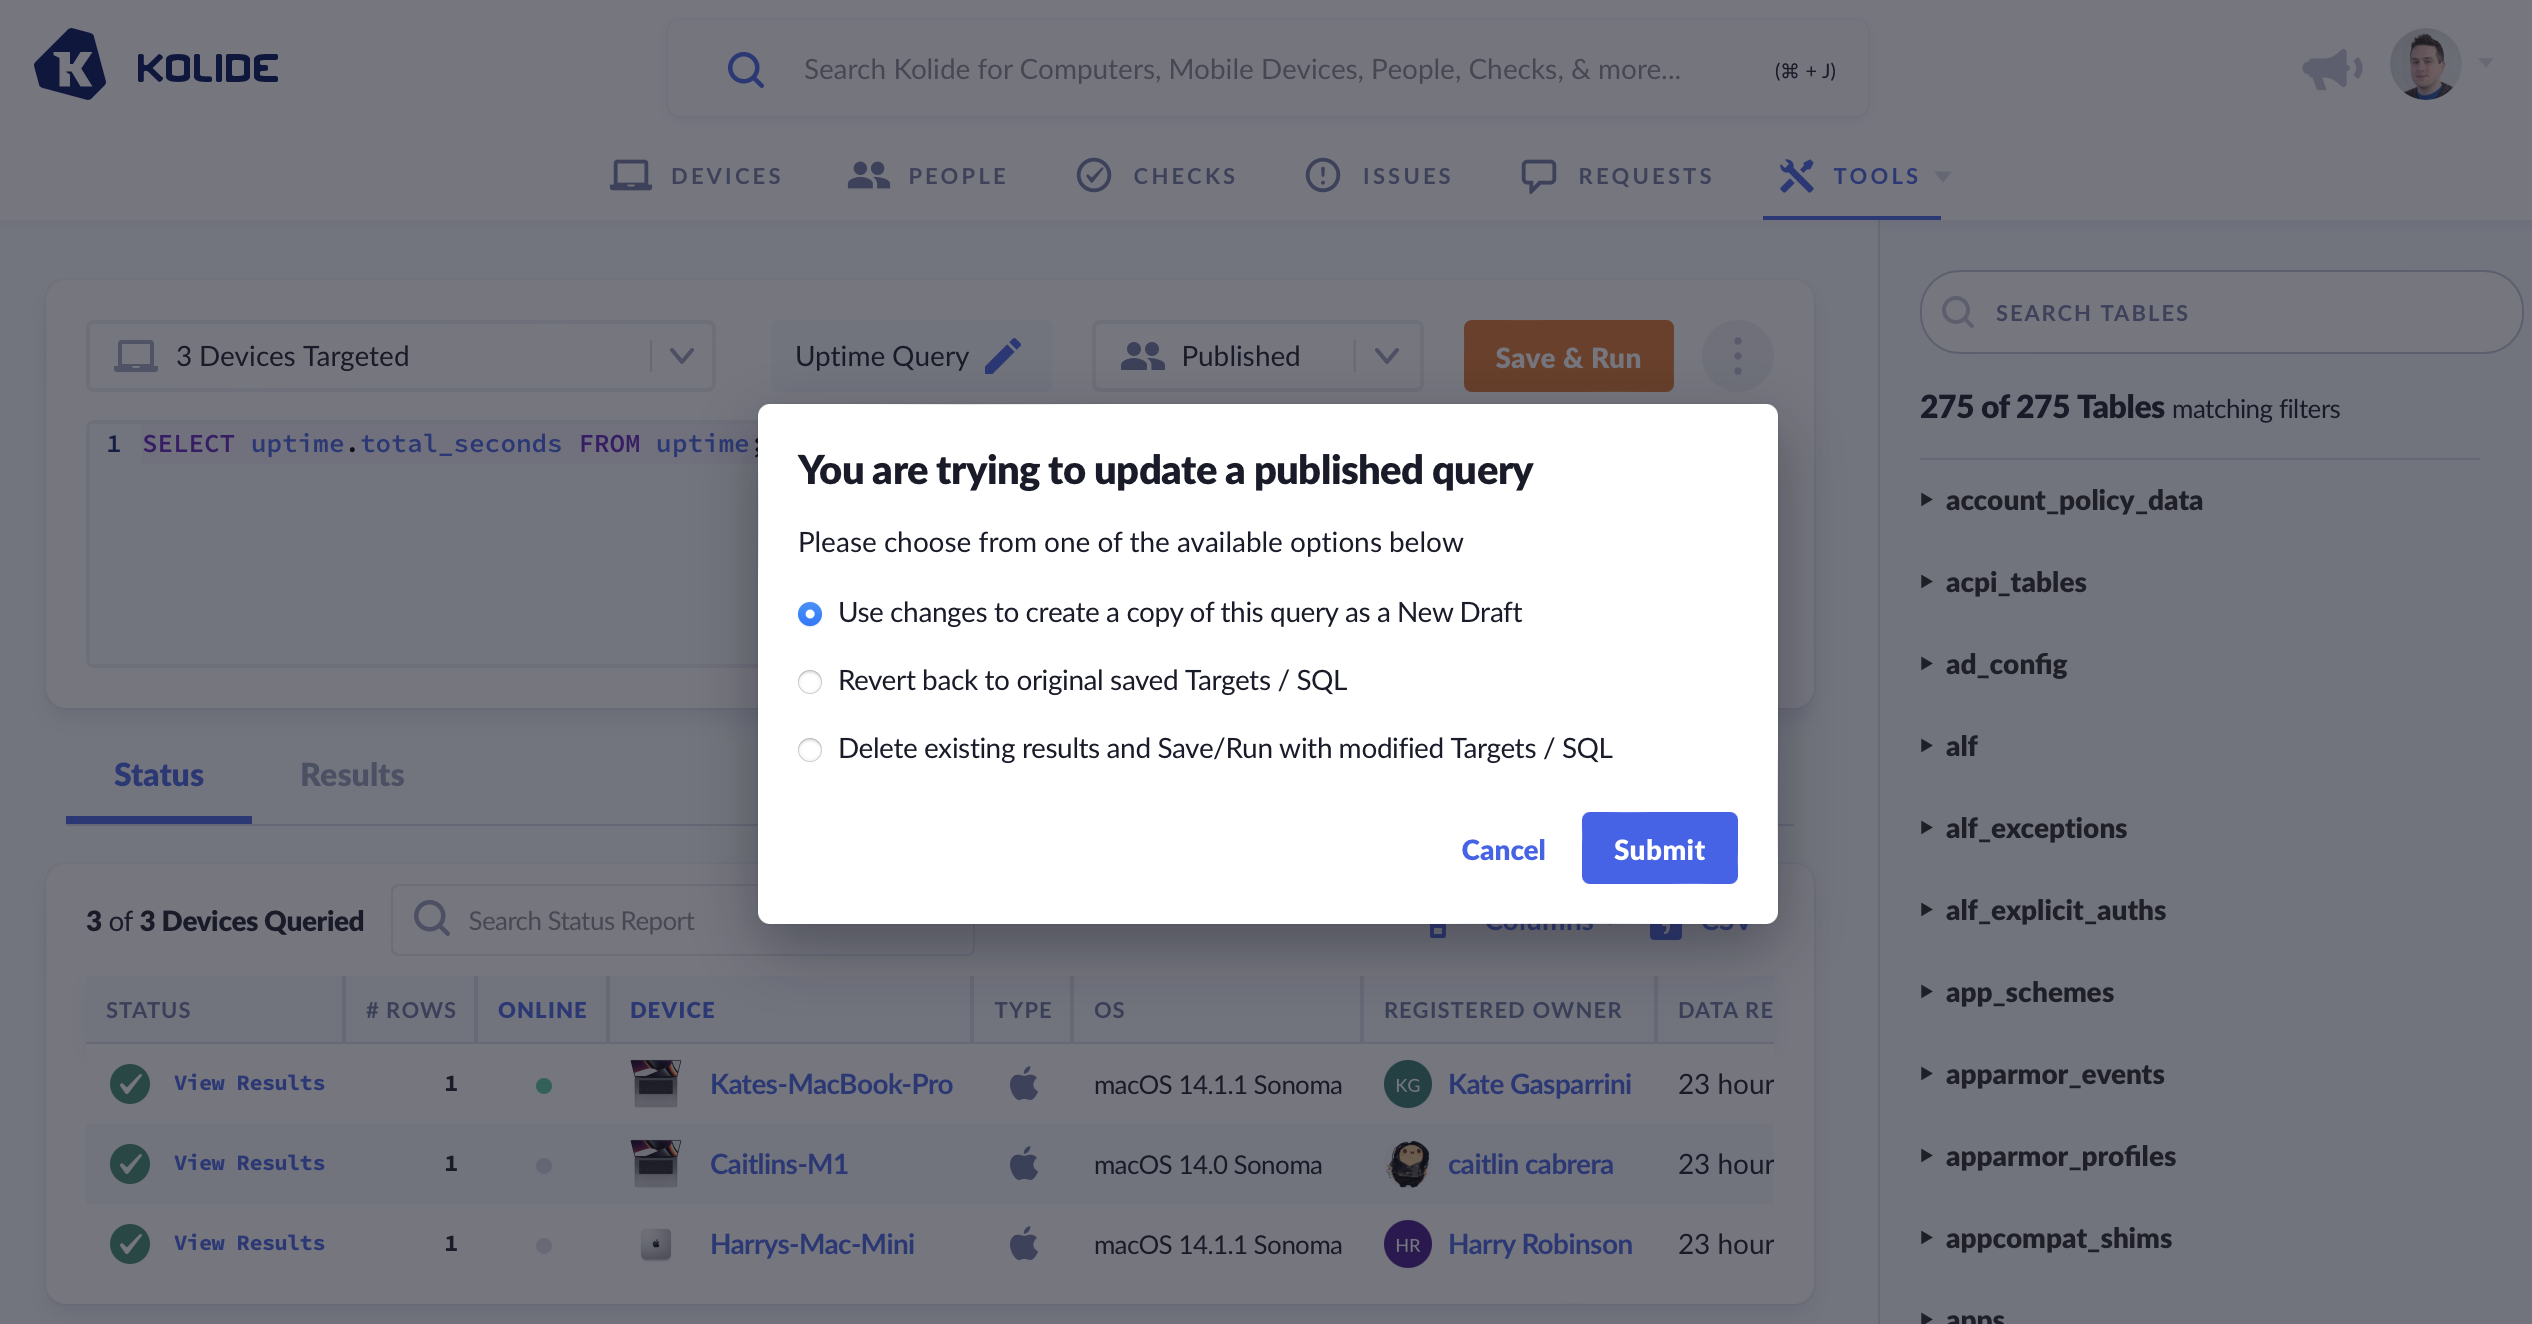
Once a query is published, any attempts to modify the query and save those changes will result in the user having to select from the options depicted in the screenshot below.
Continuously Running Queries
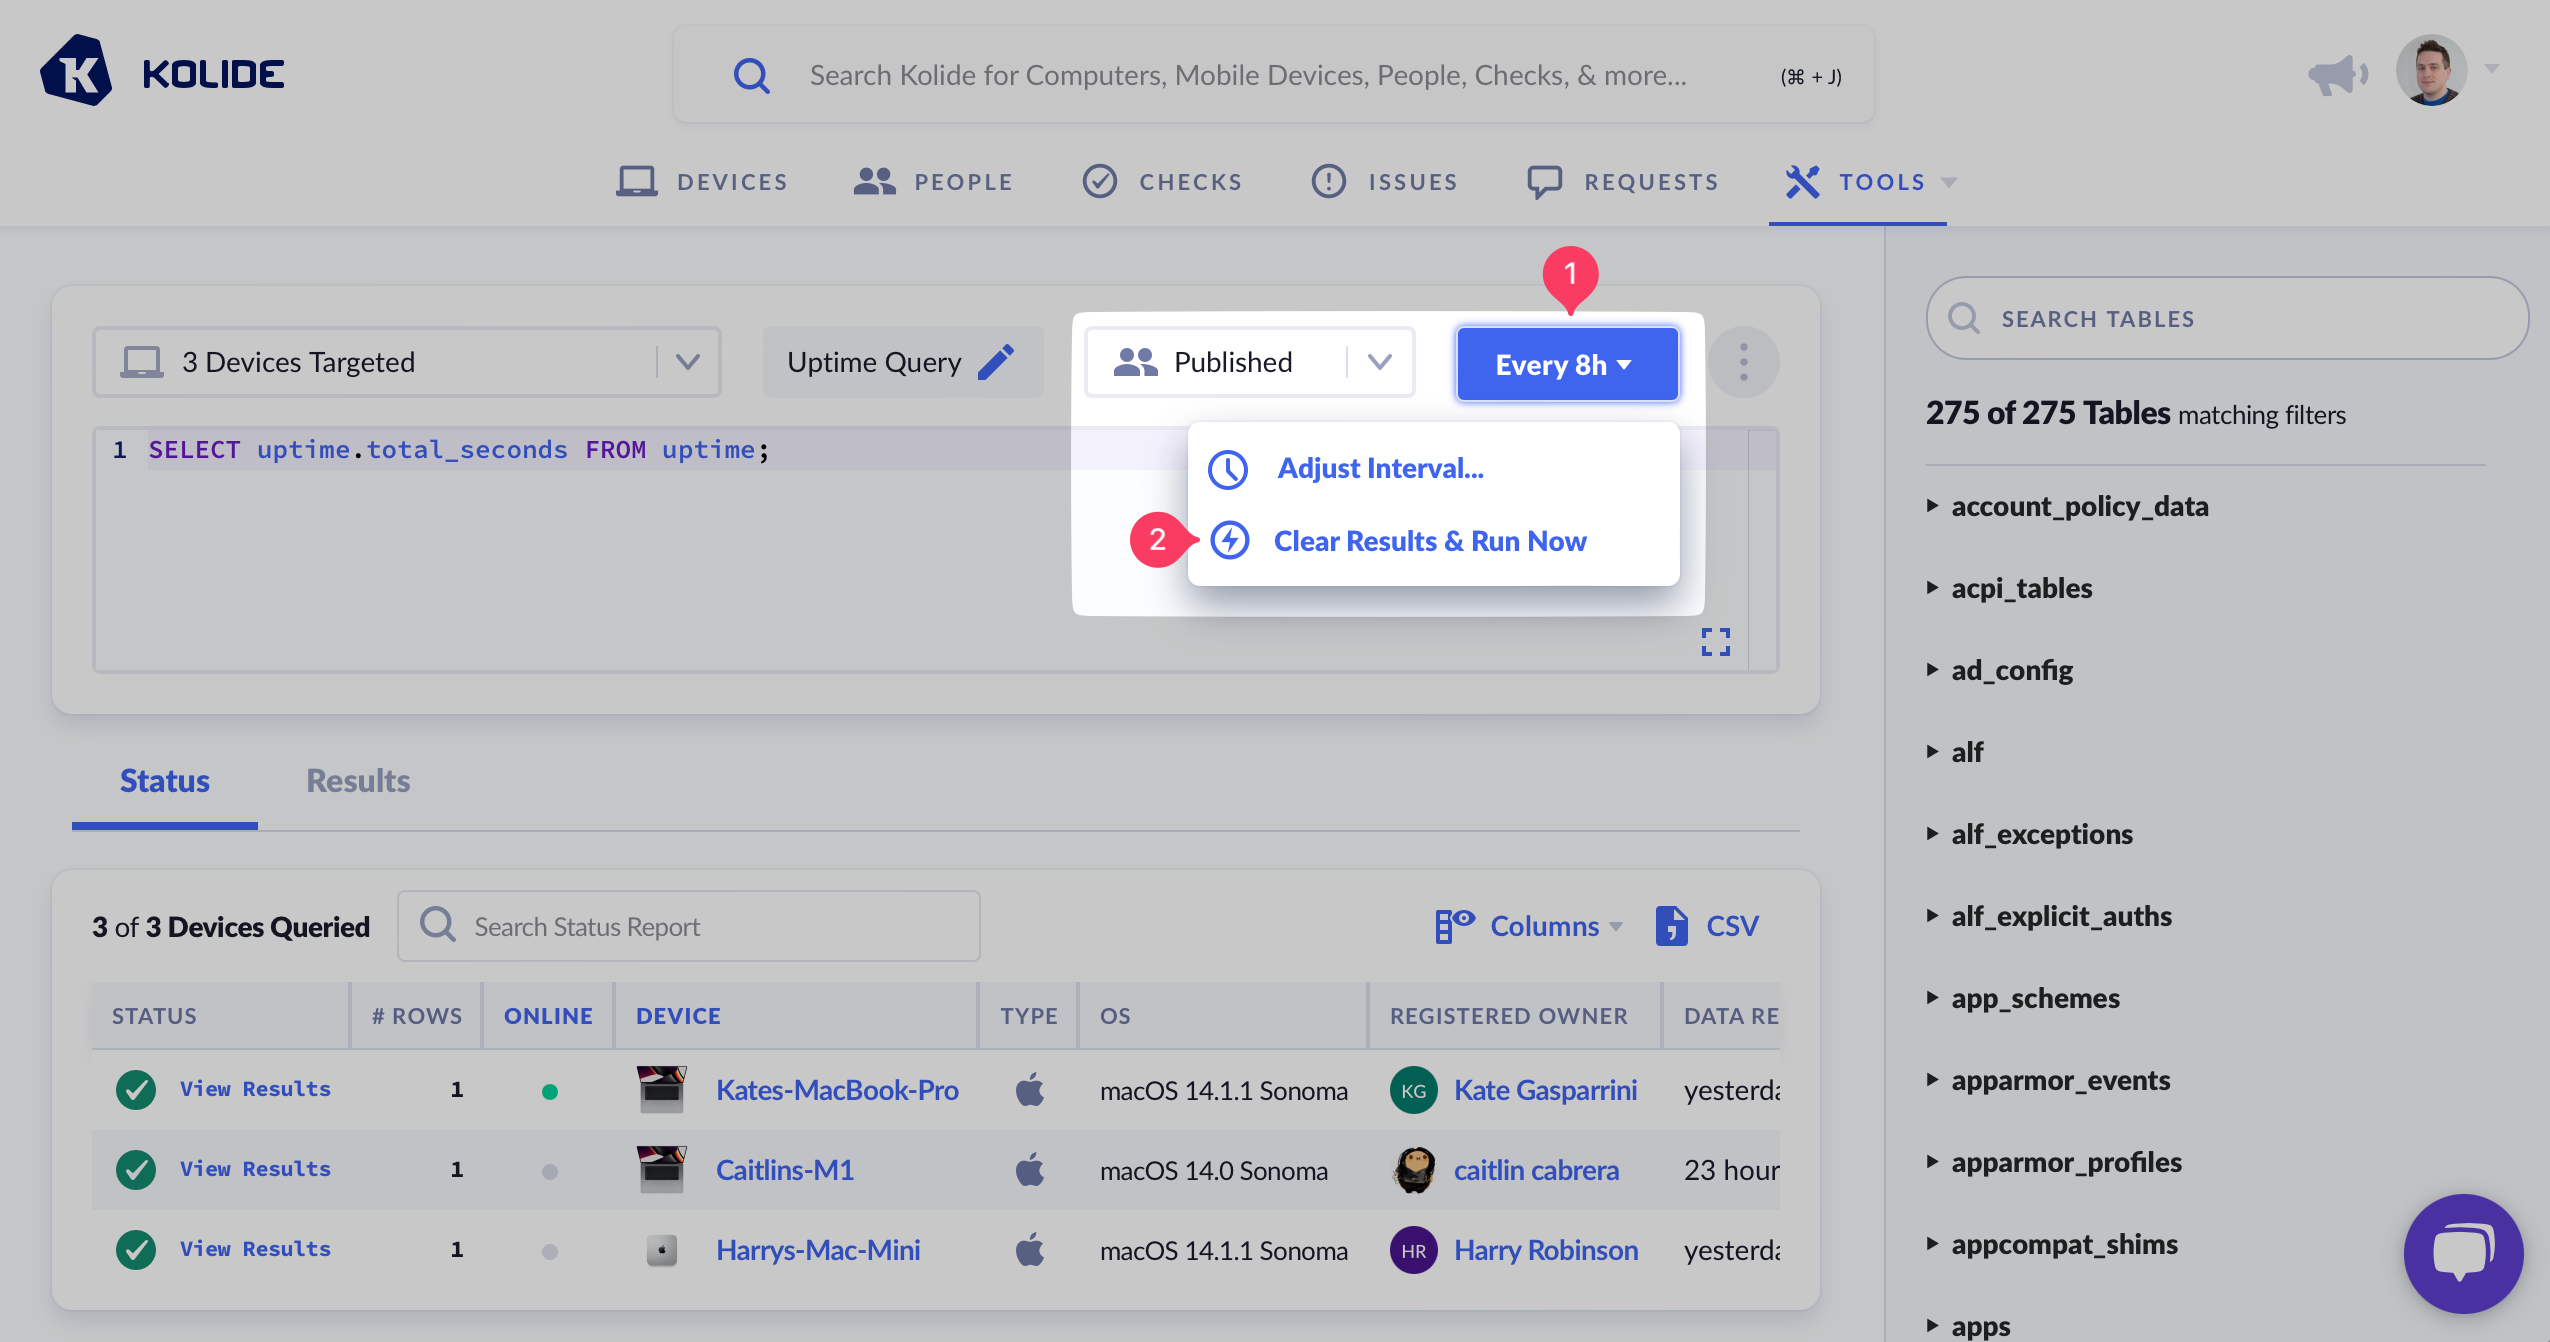
Once you have a query you’re happy with and you’ve published it, you may want to also run it on a regular basis so that the data stays fresh. To accomplish this, first create a Live Query and publish it. Then, follow these steps:
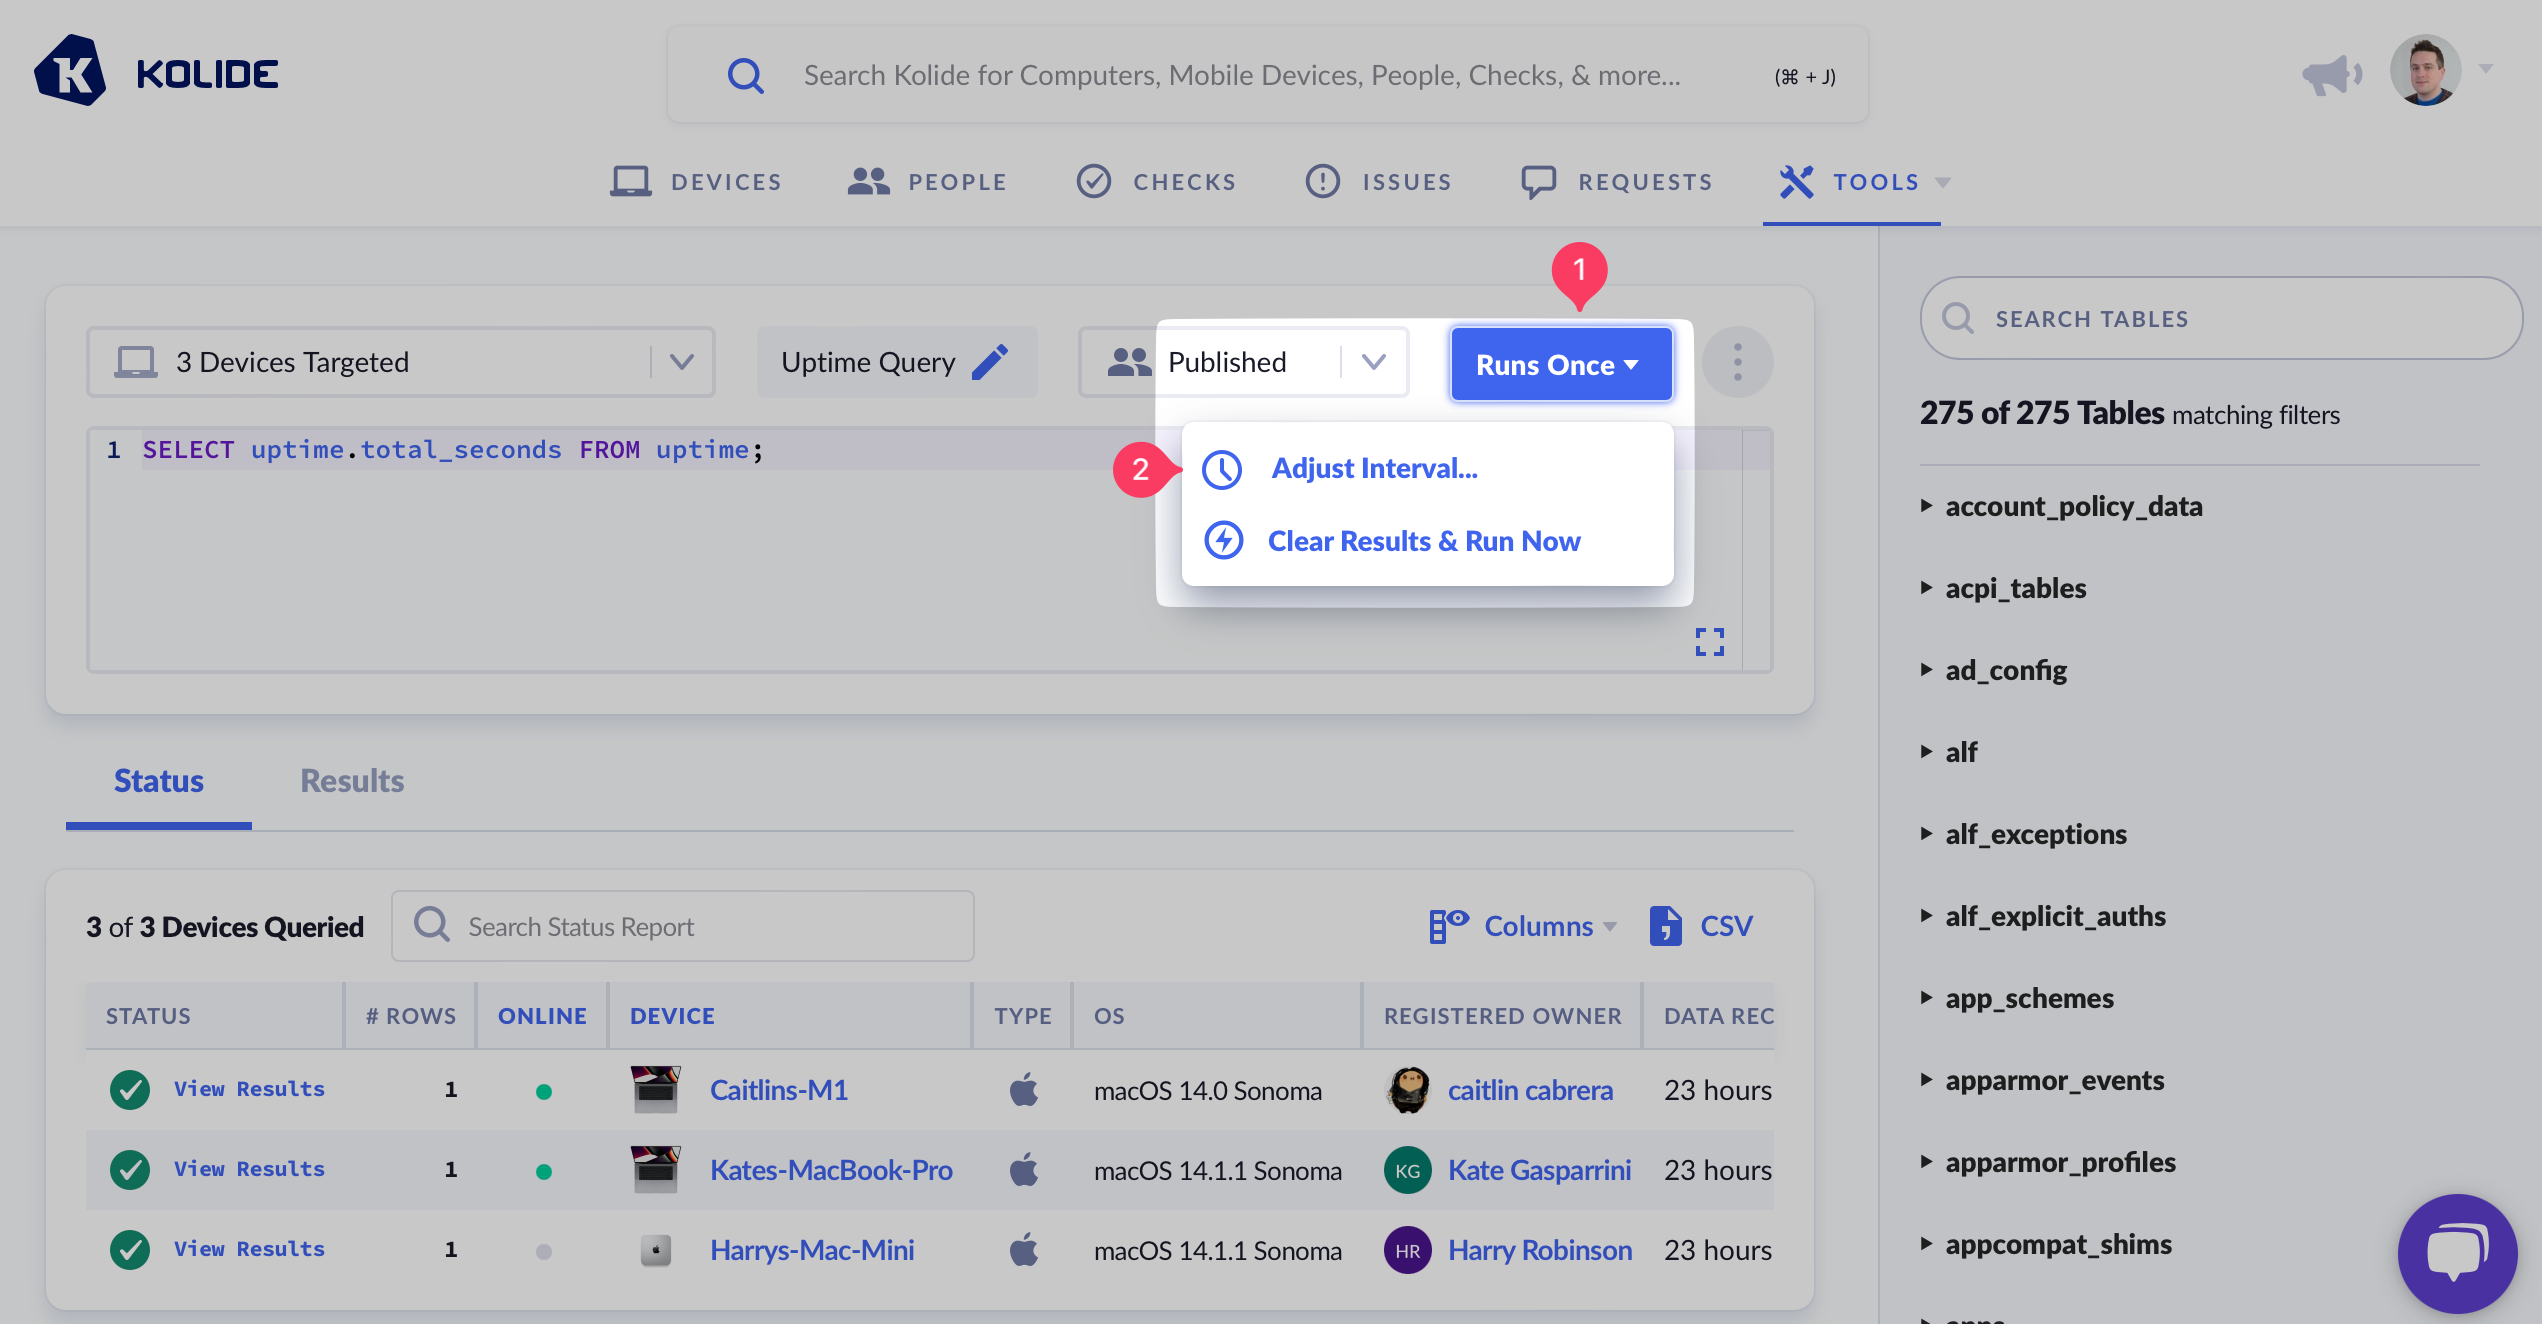
- Next to the Published dropdown, select the button that says Runs Once.
- In the menu that appears, click Adjust Interval…
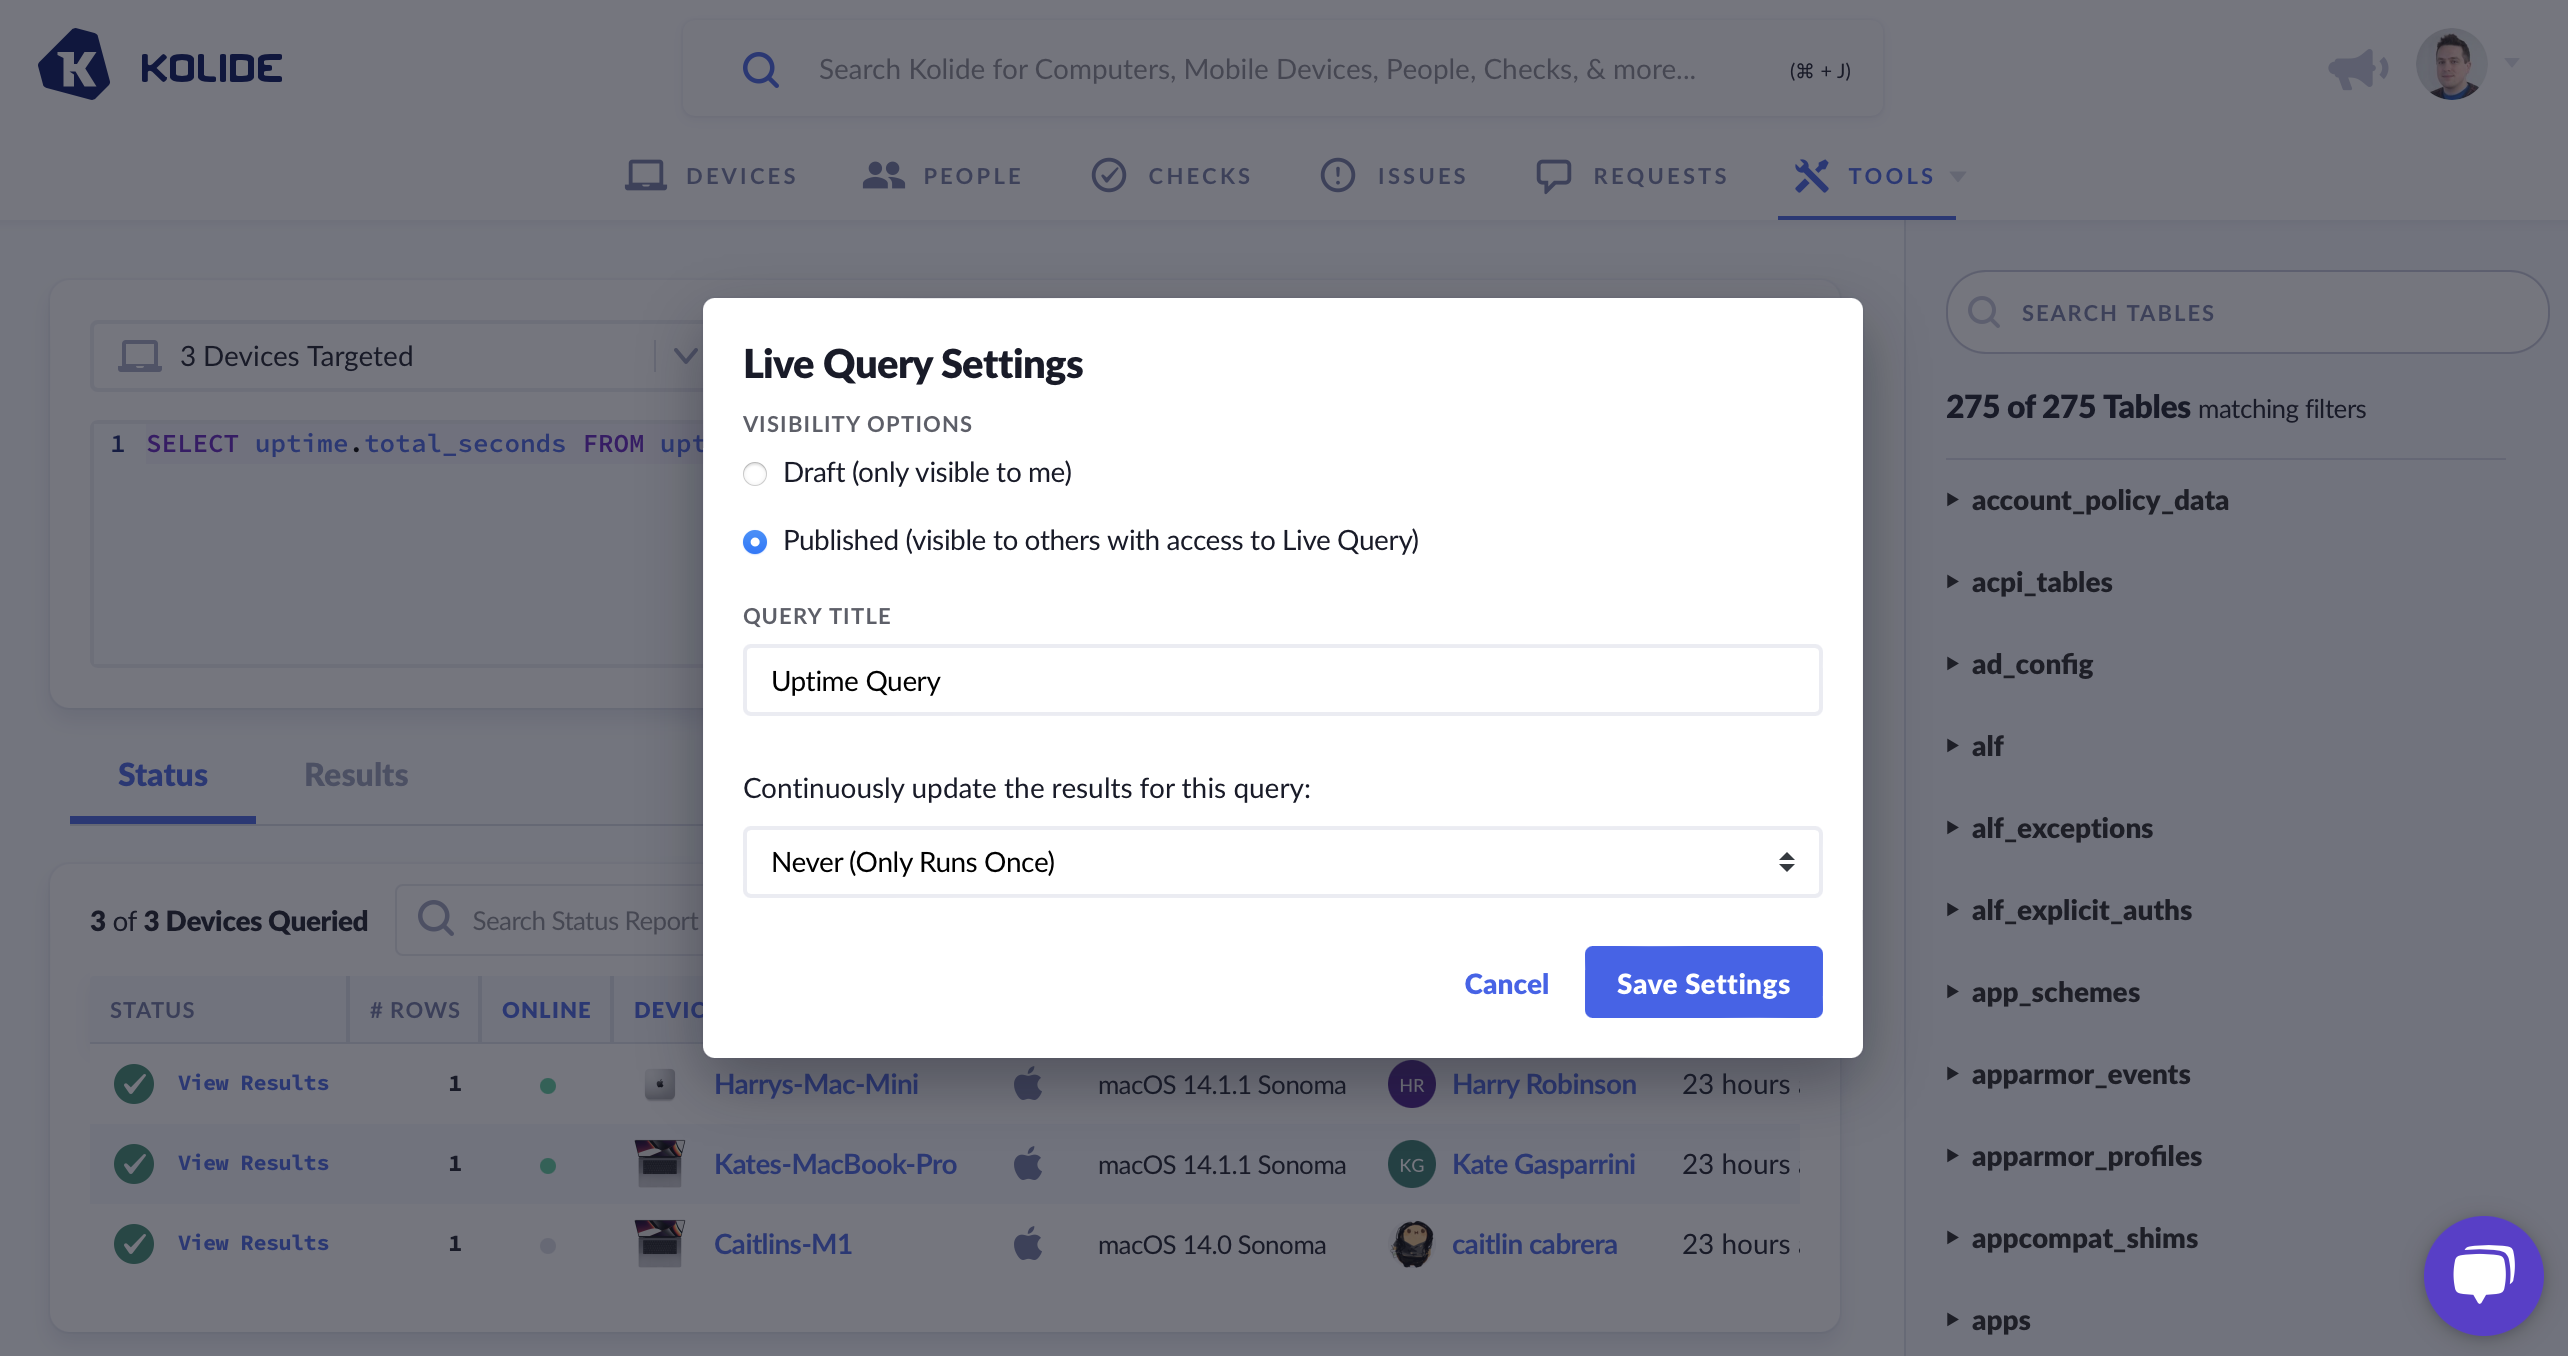
- In the pop-up that appears, change the selection in the field labeled Continuously update the results for this query. The following options are available:
- Never (Only Runs Once)
- Every 30 Minutes
- Every Hour
- Every 2 Hours
- Every 4 Hours
- Every 8 Hours
- Click Save Settings
The query will now be scheduled on the osquery agent at your specified interval. You can also decide to clear the results and run a query ad-hoc.
